
Canadian Mesonet Project Update (v2025.02.05): New Measurements, Weather Alert Popups, Exporting, and More!
This update to the Canadian Mesonet Portal introduces more available meteorological variables, a search function, improved weather alerts, new ways to view the data, sharing capabilities, and other minor fixes!
New Measurements
Added 20+ new measurements that can be displayed in the graphing tool. The full list of measurements now include:
- Air Temperature
- Average Wave Height
- Ceiling Height
- Dew Point Temperature
- Fire Weather Index
- Global Solar Radiation
- Heat Index
- Hourly Precipitation Rate
- Maximum Wave Height
- Mean Sea Level Pressure
- Peak Wave Height
- Precipitation
- Precipitation Type
- Rainfall
- Reflected Shortwave Radiation
- Relative Humidity
- Sea Surface Temperature
- Snow Depth
- Snowfall
- Subsurface Temperature
- UV Index
- Visibility
- Wave Direction
- Wave Height
- Wet Bulb Temperature
- Wind Chill
- Wind Direction
- Wind Gust
- Wind Speed
Search
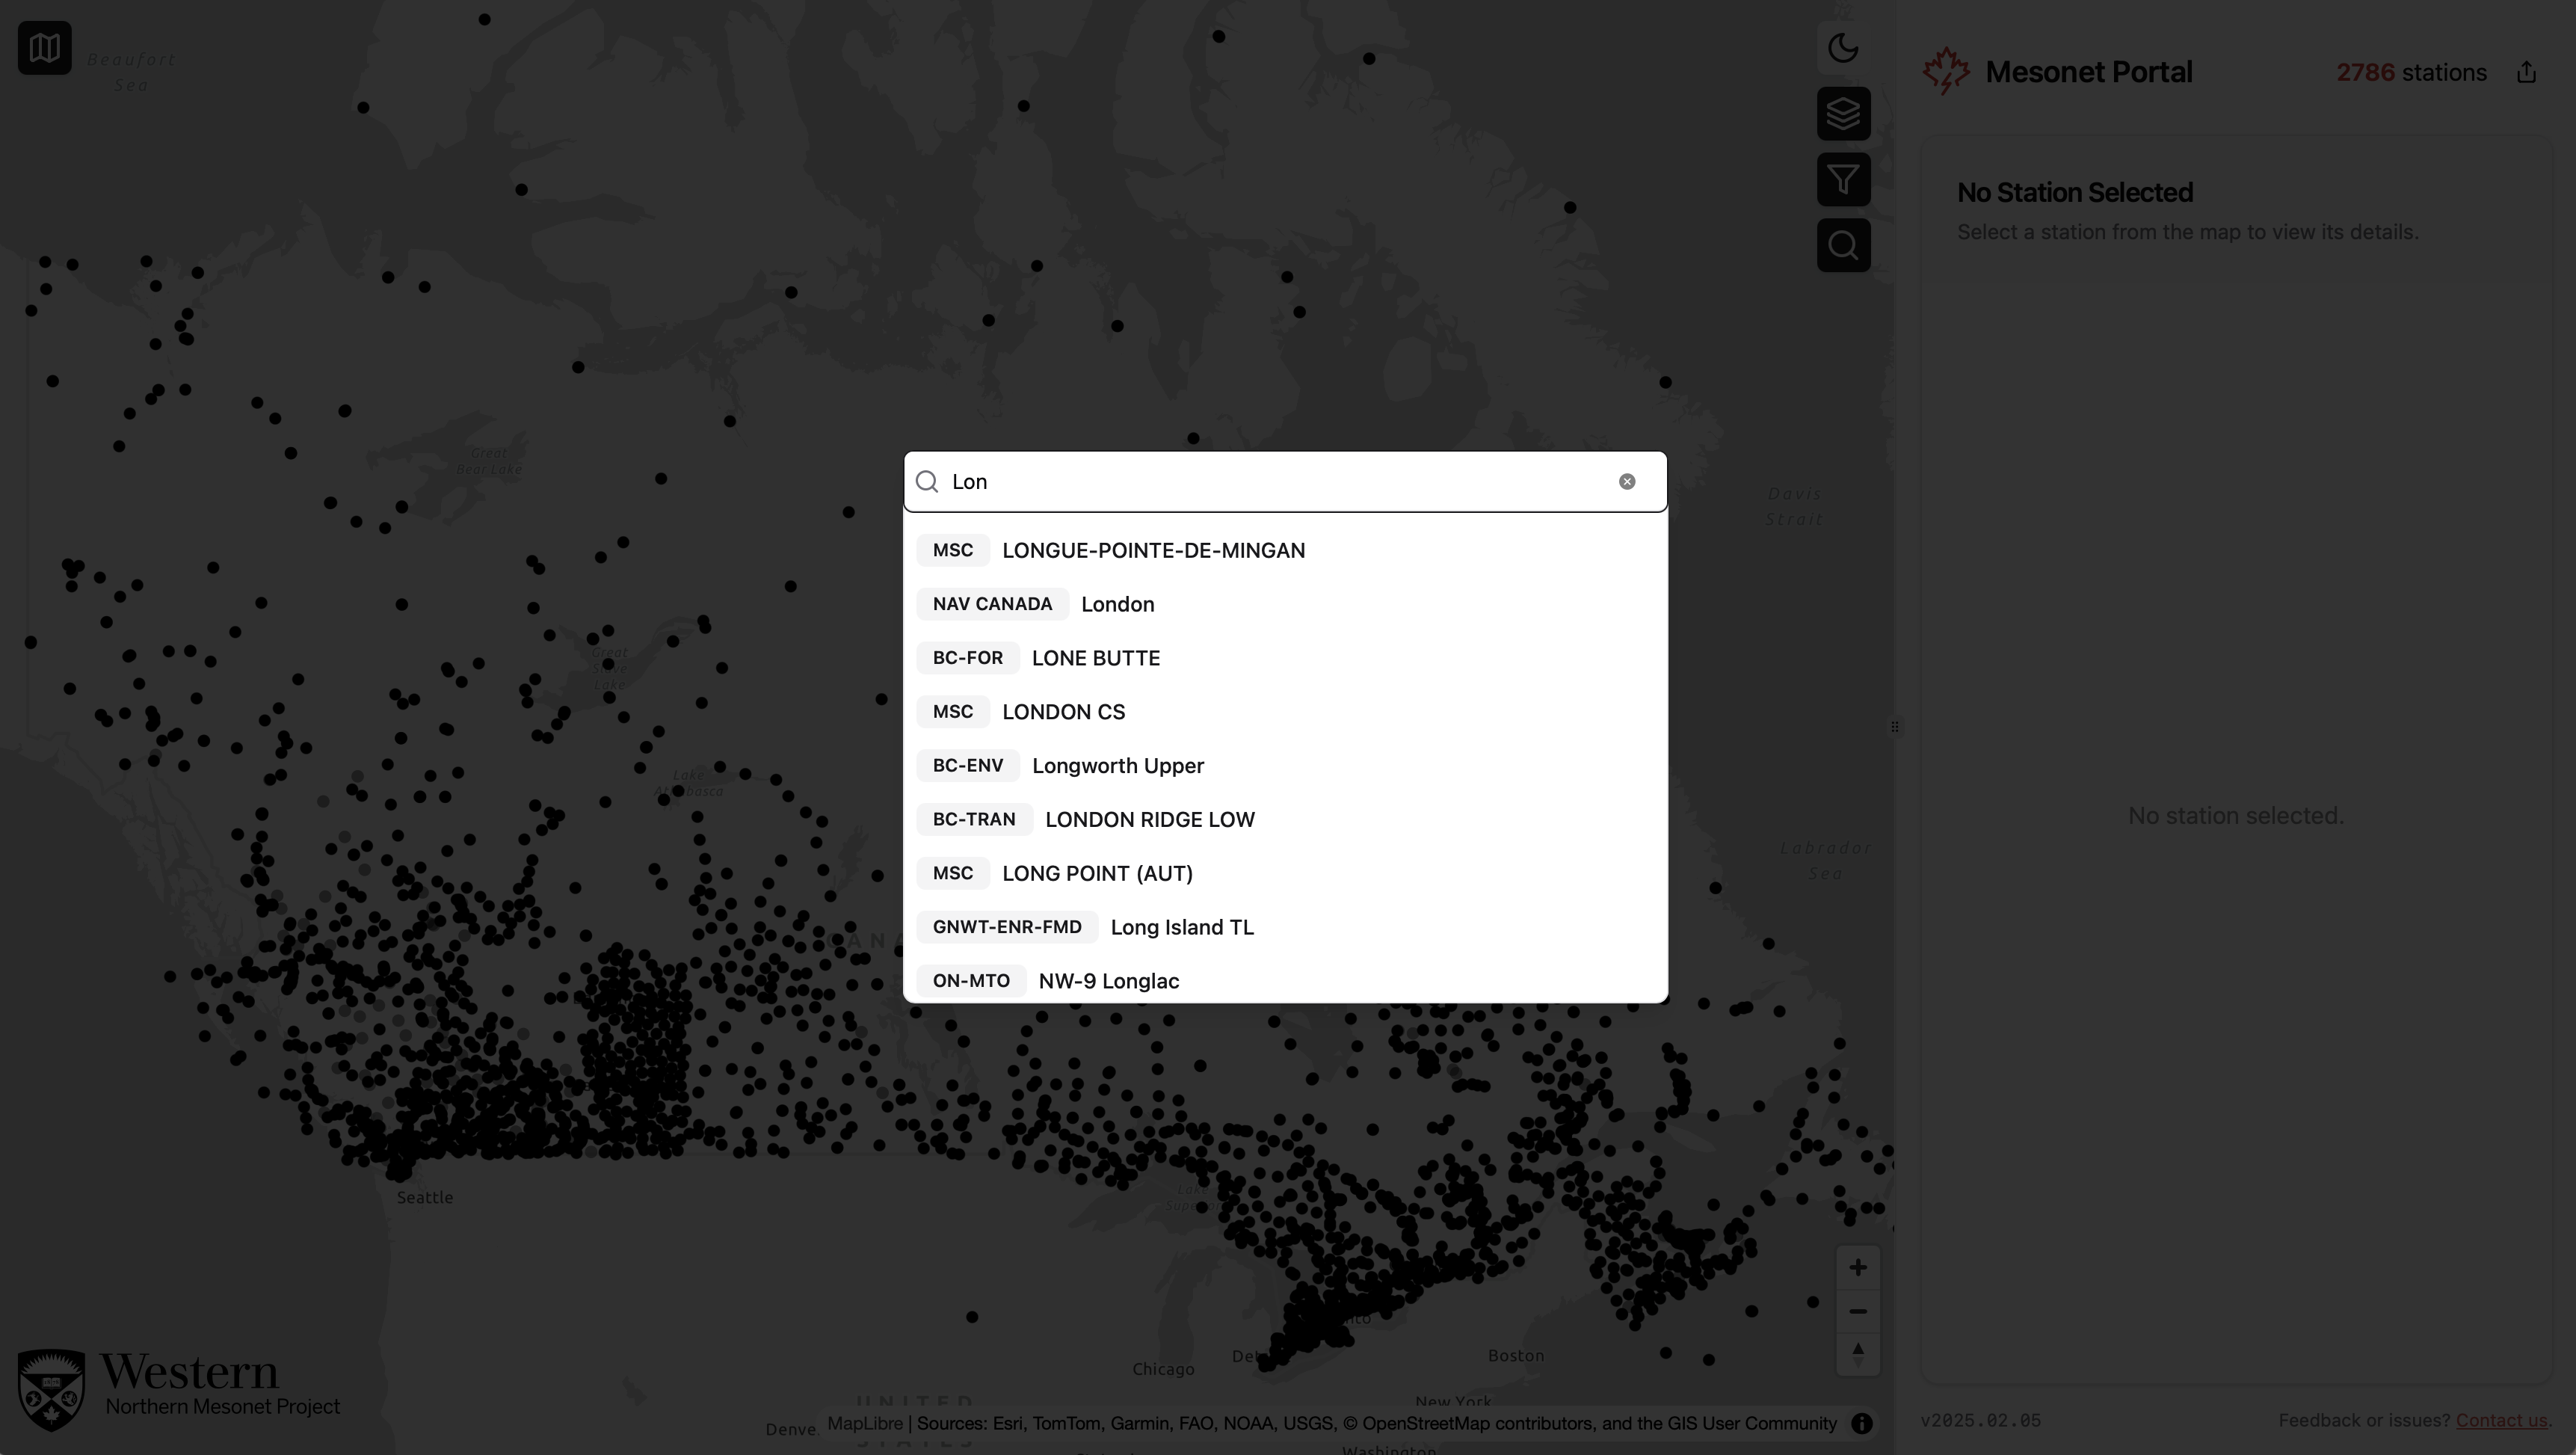 A new search button has been added to the top right of the page. This will allow you to search for any station or network on the map, zooming to the selected station and displaying the relevant information.
Weather Alert Popups
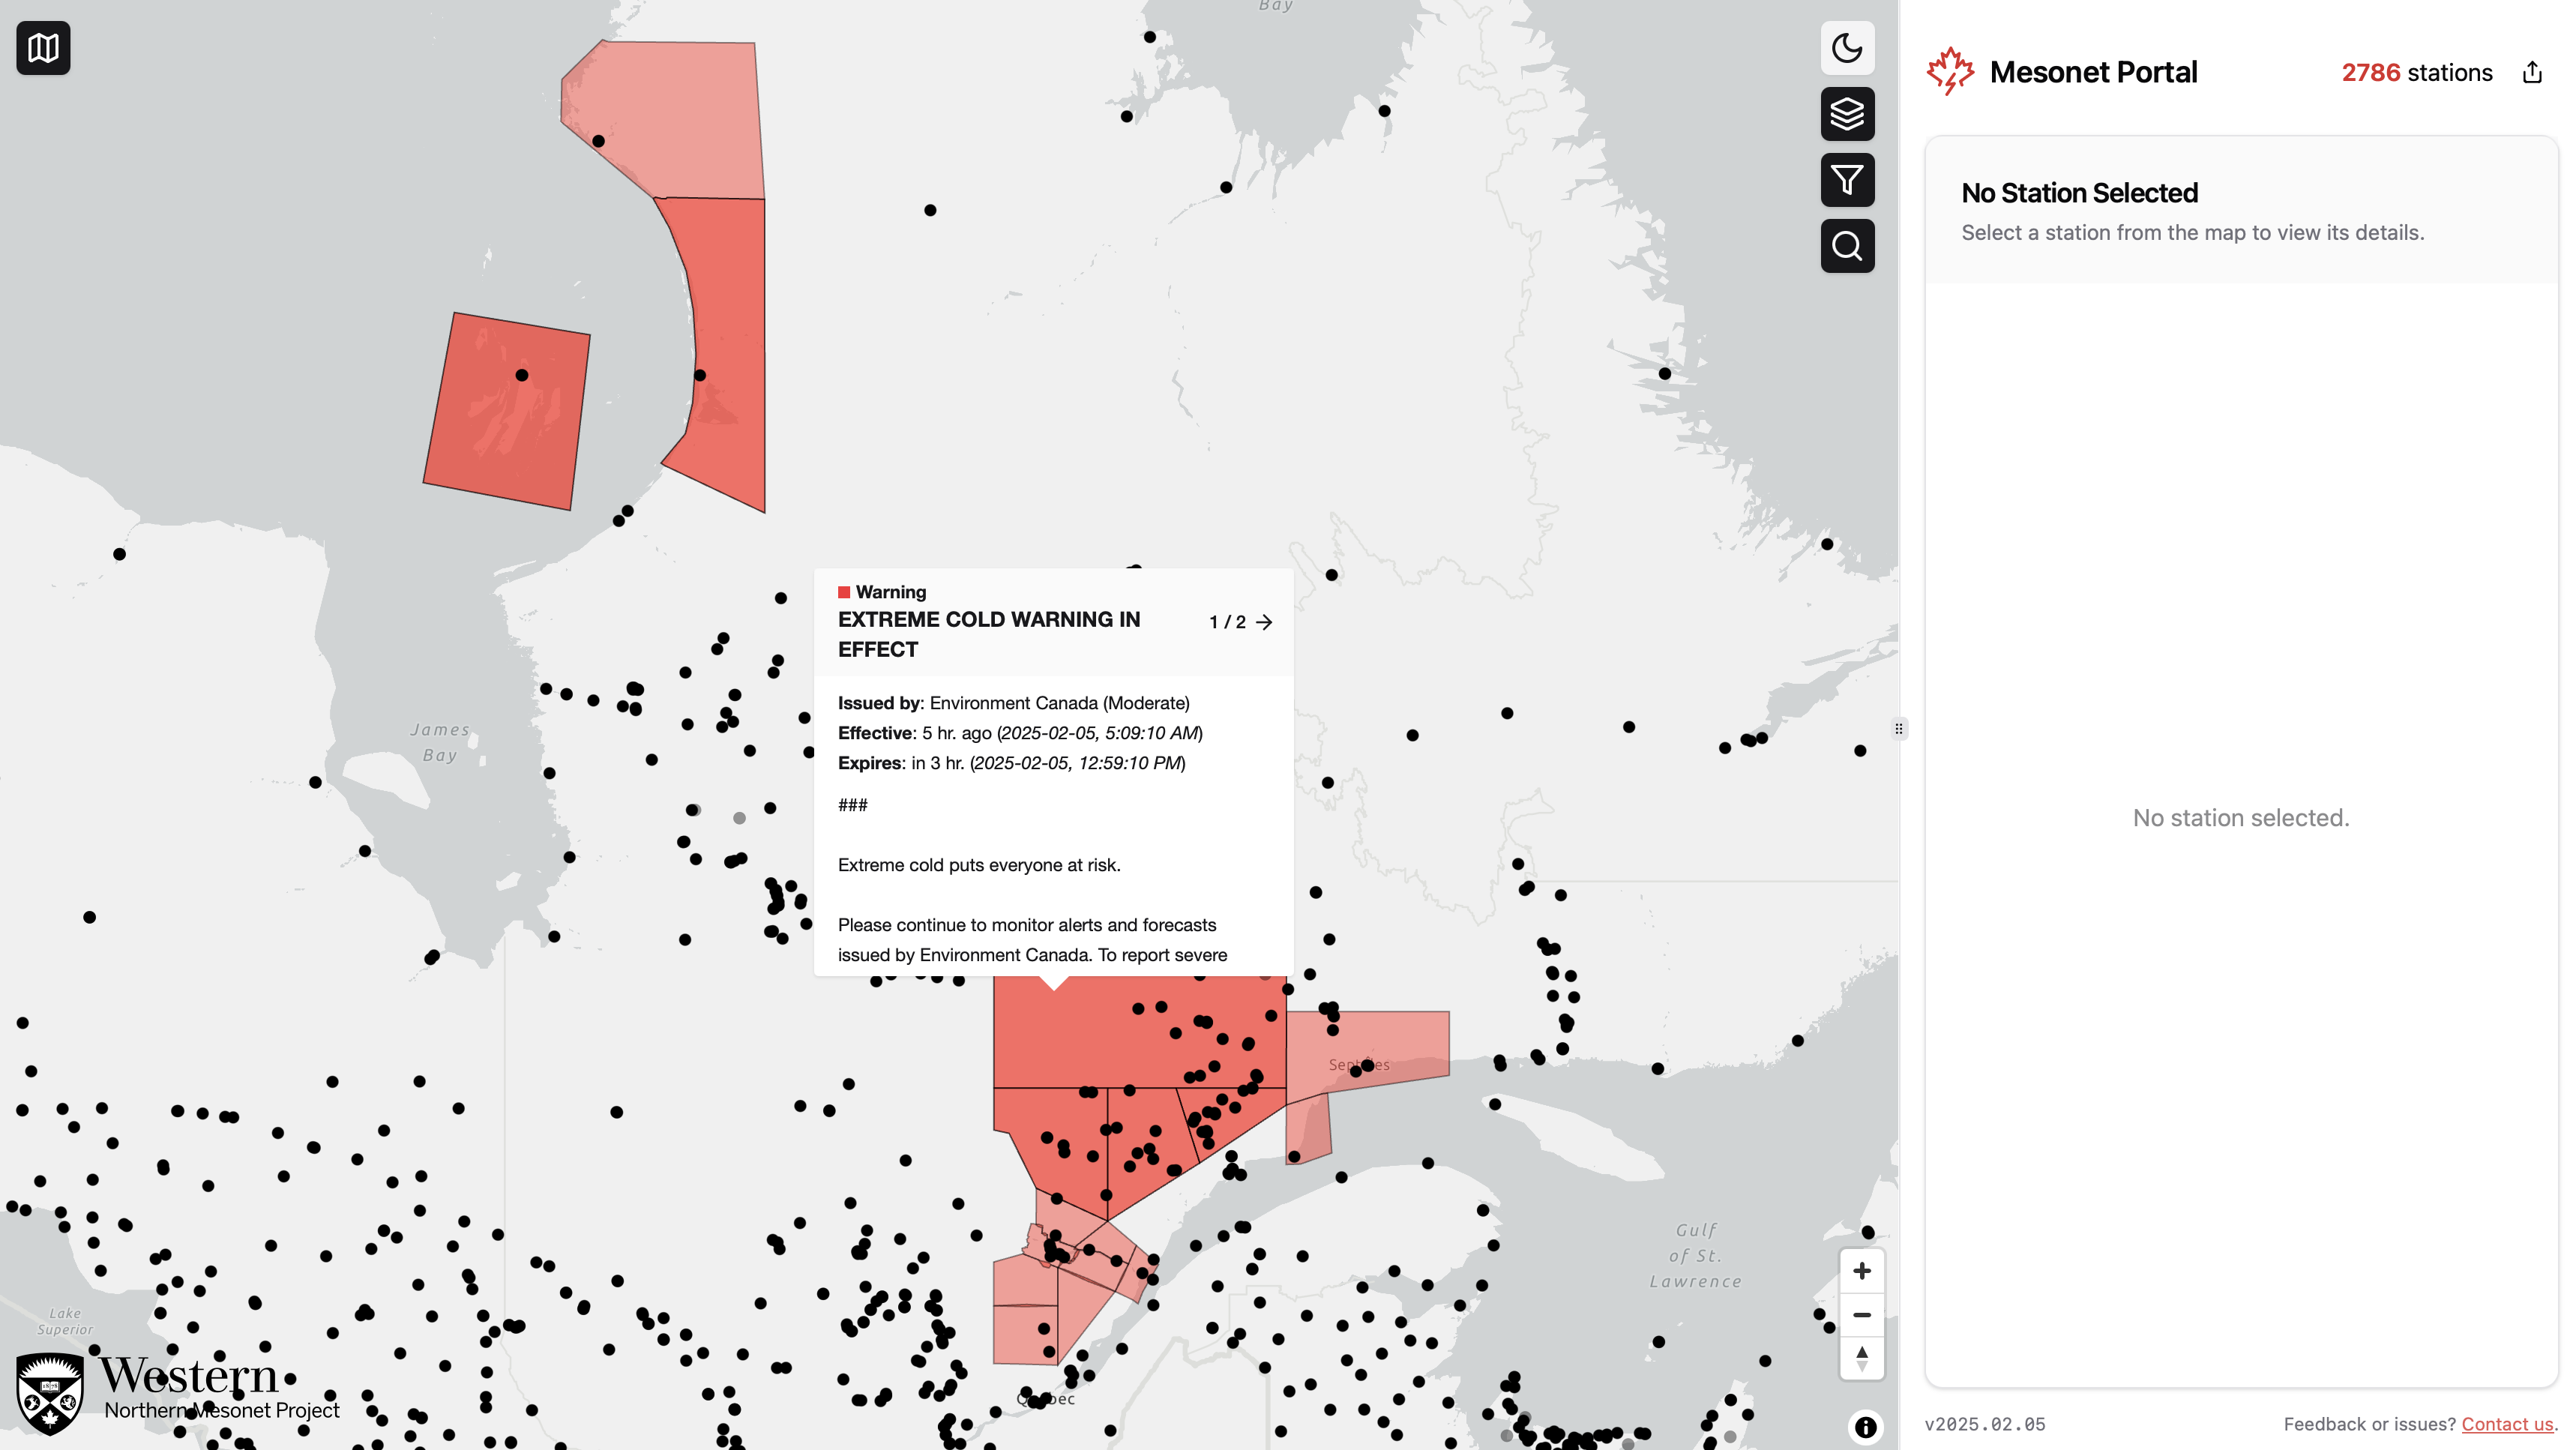
A new weather alerts layer has been added to the map. This layer will display any active weather alerts in the area, with a popup showing the details of the alert when clicked. The layers are colour-coded to indicate the severity of the alert, and a legend has been added to the map to explain the colours. Alerts can stack on top of each other, so you may see multiple alerts in the same area. Using the popup, you can see the details of each alert.
Simplified Station View
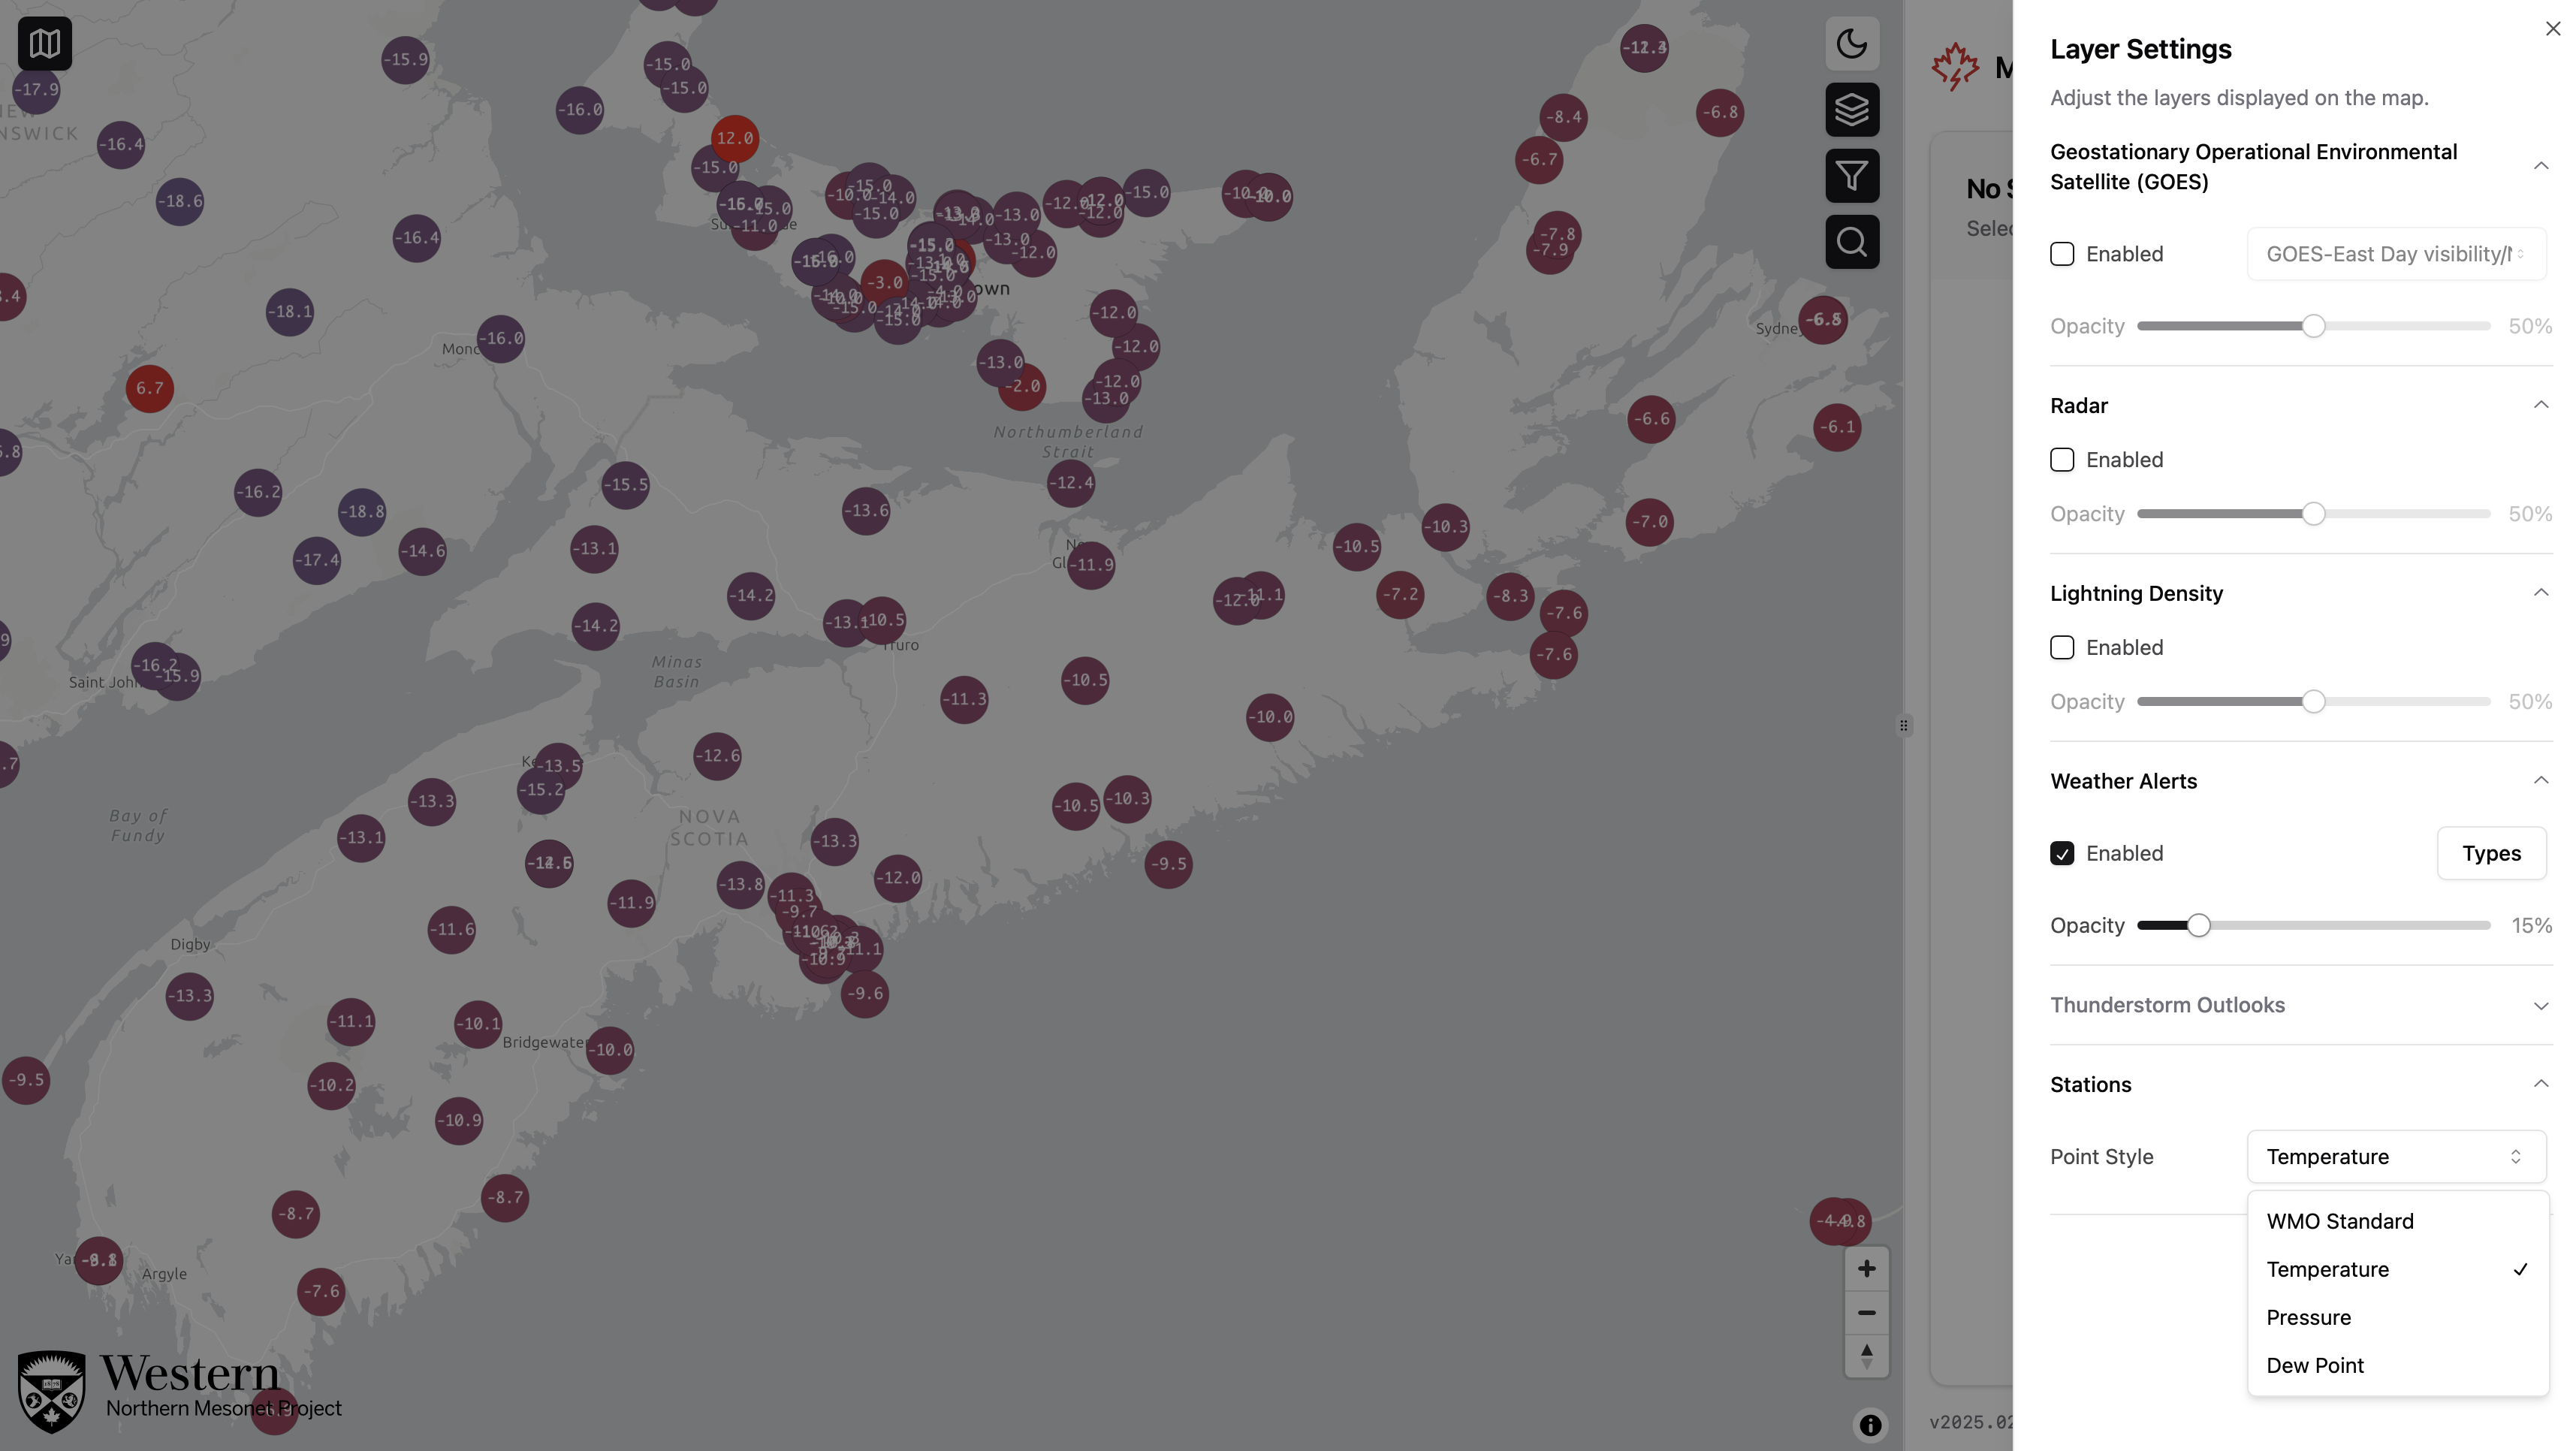
The station layer options have been overhauled to provide a more simplified view of the data. The layer now includes options to display certain variables as a color scale as well as the recorded value.
Export View State
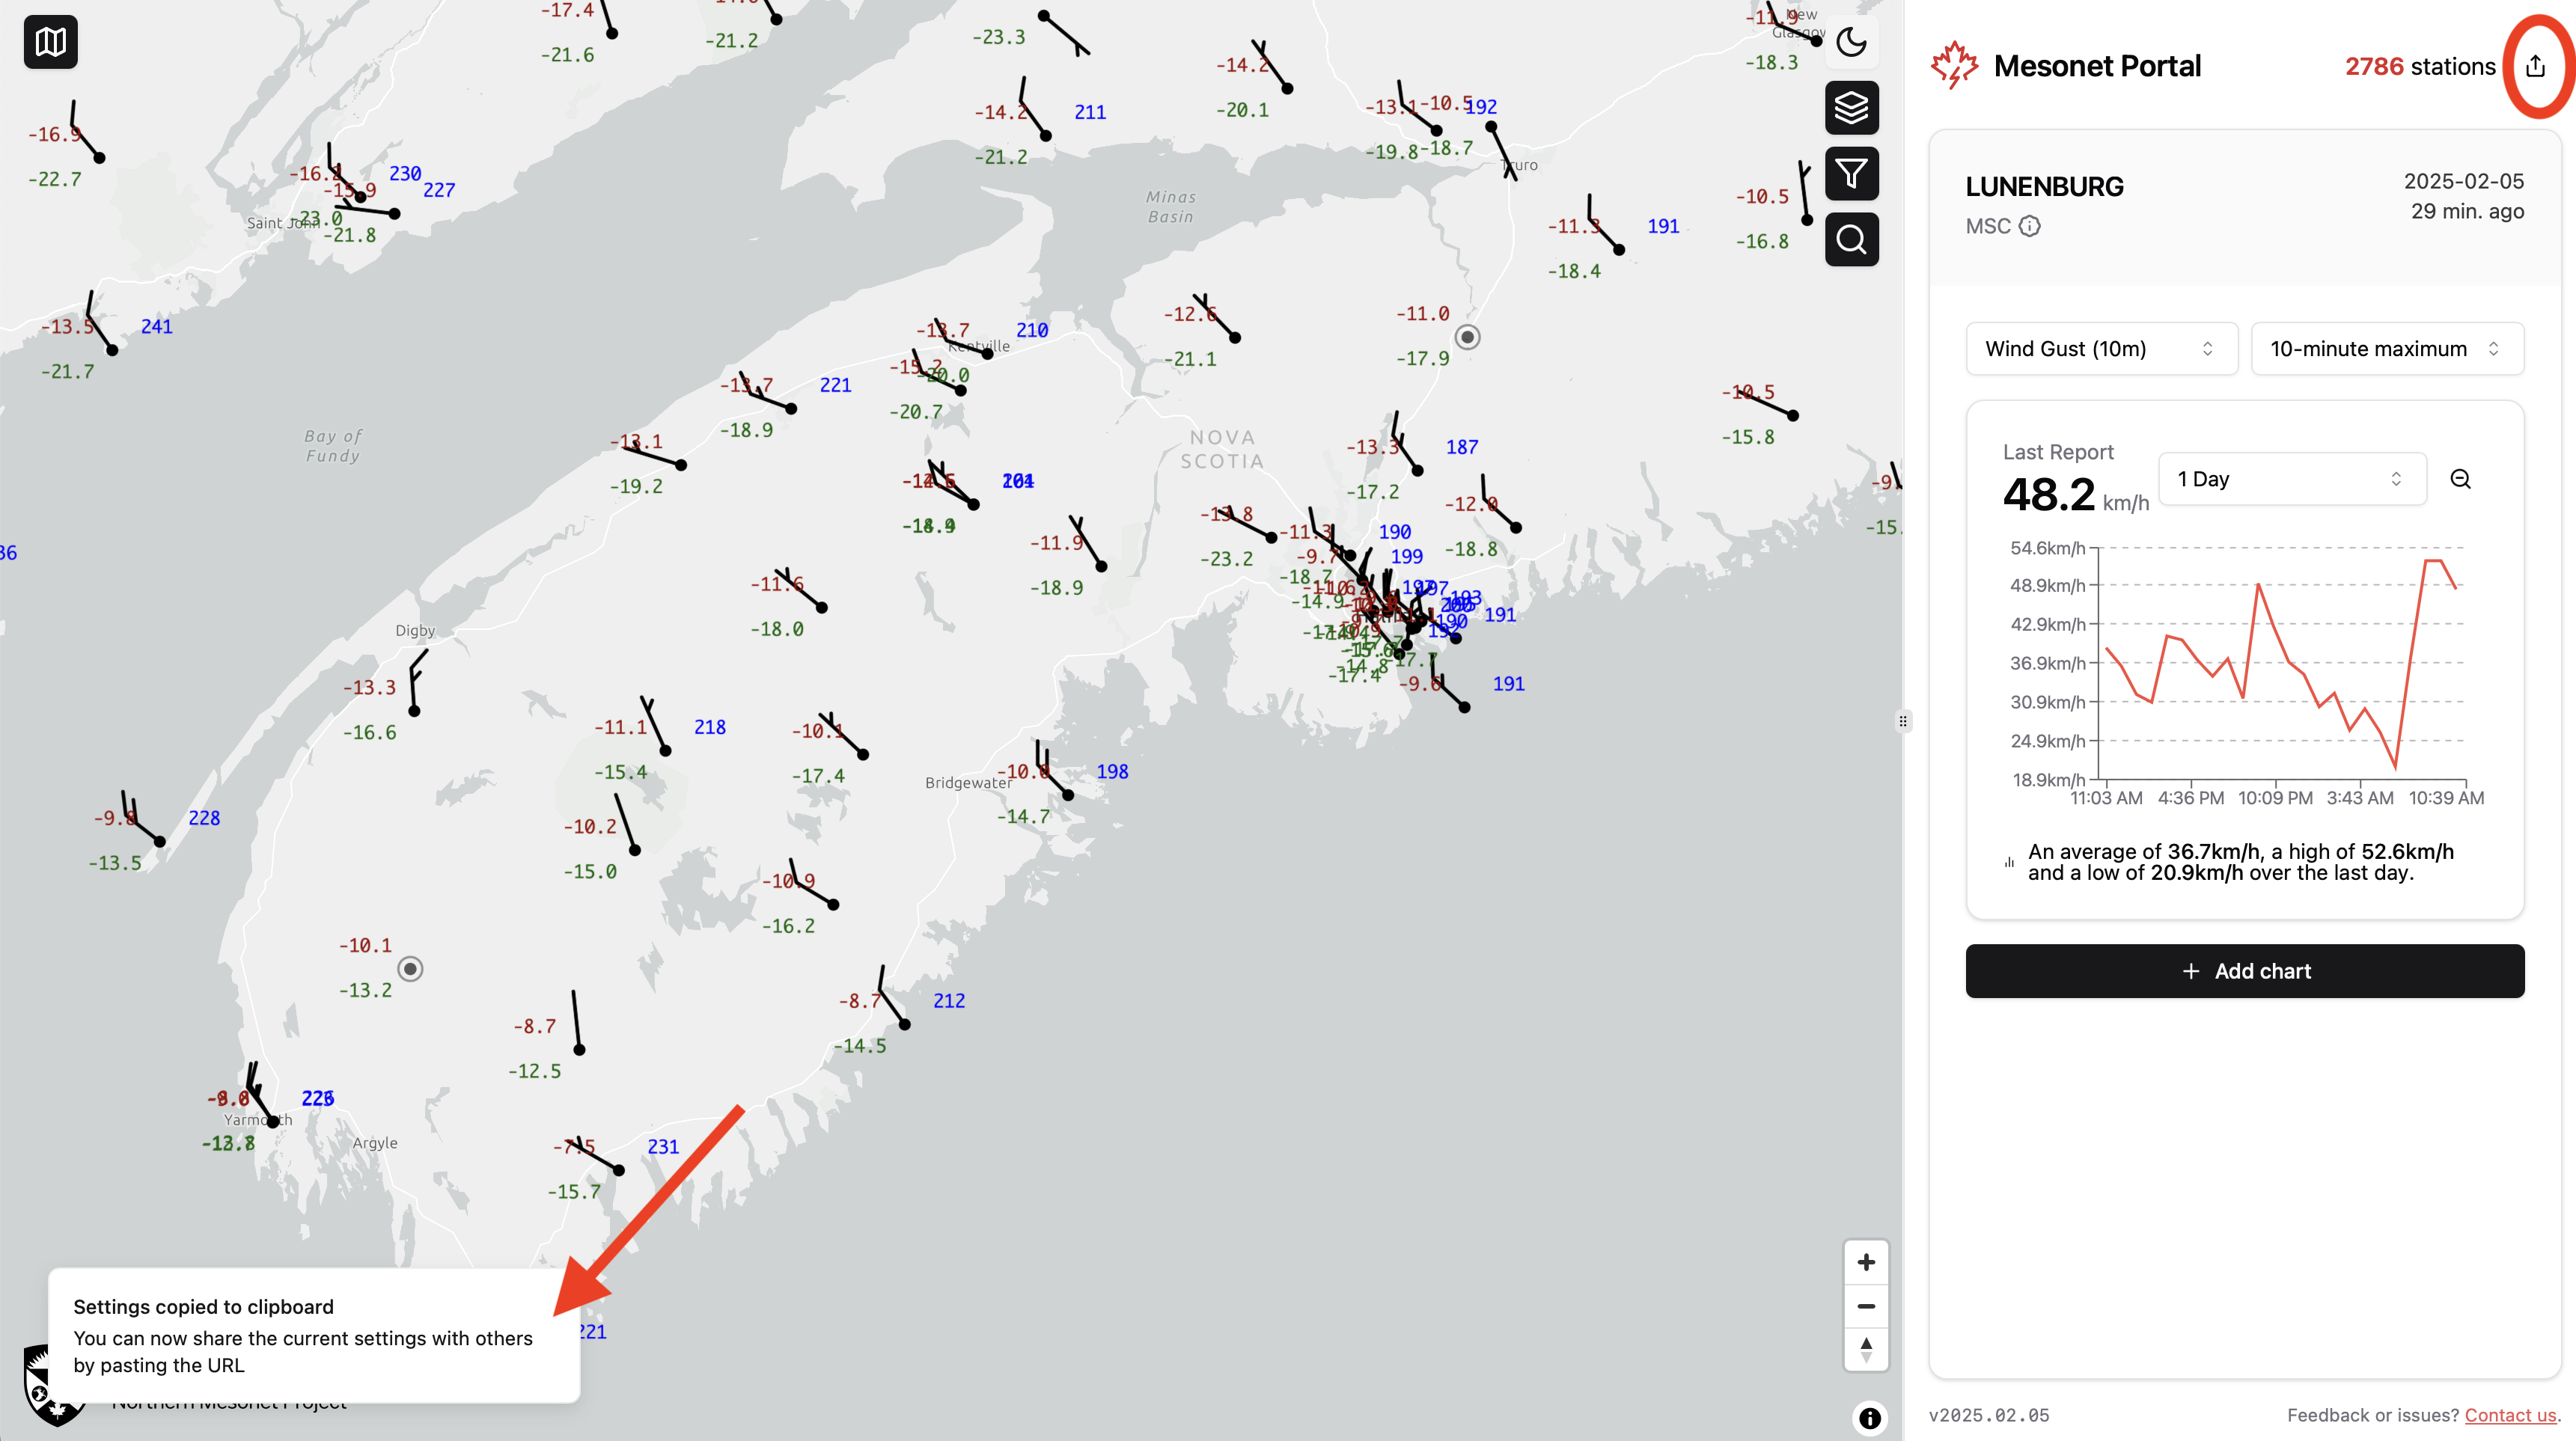
You can now share the current filters, layers, and view state by clicking the share button in the top right of the page. This will generate a URL that you can share with others to show them the same view you are currently seeing. You can also bookmark this URL if you would like to save your preferred settings / location.
Bug Fixes and Improvements
- The data loading process has been optimized to reduce the time it takes to load the map and display the data. This should result in a faster and more responsive experience.
- Many of the project dependencies to keep the application up to date.
- Fixed a bug where stations that did not report temperature data would not display graph data.
- Improved mobile scaling for better usability on smaller screens.
If you have any feedback about this update, please email nmp@uwo.ca!