Resources
We are located at:
North Campus BuildingRoom 120
Western University
1151 Richmond St. N.
London, Ontario
N6A 5B7 Canada
geocollections@uwo.ca
Historic Geophysical Equipment
Sprengnether Seismometer
The instrument located on display across the hall from BGS 0162 (photo coming soon) is a Sprengnether Horizontal Component Seismometer, Series H. The instrument, originally designed in the 1940s, functioned utilizing a horizontal pendulum and a generated electromagnetic field. When a ground vibration occurred, the horizontal pendulum would move, inducing a current in the electromagnetic field which would then be recorded. This seismometer is a horizontal component seismometer, meaning it can only measure side to side seismic movements parallel to the ground surface in either the N-S or E-W directions. To capture up and down motions, the device would be used in tandem with a vertical component seismometer, as pictured below. These seismometers were originally invented with the intention of use for tracking hurricanes.
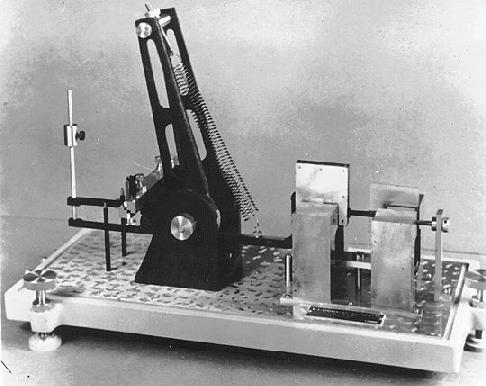
Willmore Seismograph
The instrument at the bottom left of the display located across from BGS 0162 (photo coming soon) is a Willmore Seismograph. Designed by Patrick Willmore in the early to mid-1950s, the device is another example of a horizontal component seismometer. The seismometer works by shining a narrow beam of light onto a damped mirror, the damped mirror then reflects the beam of light onto a photosensitive recording paper. When ground motion occurs, the mirror mounted on the seismometer will shift slightly causing the motion to be recorded onto the photosensitive paper. The device was specifically designed to be a more portable version of the bulky seismometers typically found at seismic observing stations at the time.
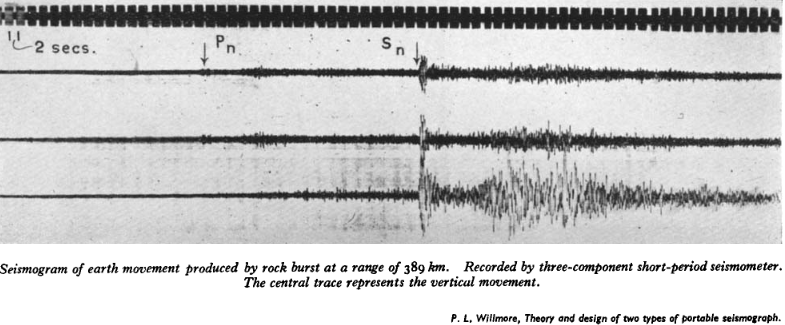
The image above is an example of the recorded seismic waveforms (seismograms) of the ground vibration amplitude with time on the three directional components, from top to bottom, E-W, N-S, and up-down (Willmore, 1950, https://onlinelibrary.wiley.com/doi/abs/10.1111/j.1365-246X.1950.tb02987.x).
Modern Geophysics Equipment at Western
Technology has come a long way since the early Sprengnether seismometers. Students enrolled in a geophysics module at Western will have the opportunity to learn how to use a variety of geophysical equipment during field courses offered by the Earth Sciences Department. Students who take these field courses come from a wide variety of interdisciplenary backgrounds. Students in the photos below are from the following programs:
- Mahmoud Bagheri is a Geophysics PhD student with Dr. Katsu Goda, and was the field school Teaching Assistant
- Gillian Noonan is an Integrated Sciences undergraduate student
- Nicole Kukura is an Honours Specialization in Environmental Science undergraduate student, with a Geology minor
- Matti Barton is a Geophysics Major undergraduate student
- Saralyn Smith is a PhD student in Geoarchaeology with Dr. Elizabeth Webb
- Sanaz Darzipour is a PhD student in Applied Seismology with Dr. Sheri Molnar
- Nasir Maiauduga is a PhD student in Exploration Geophysics at Laurentian University
The below photos were taken during Geophysics Field School in August/September 2023, ES 4451Z/ Geophysics 9509.
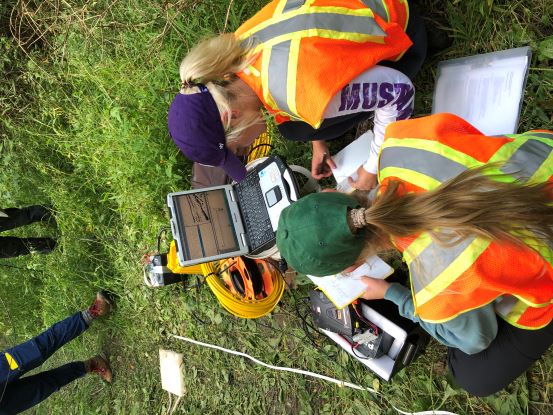
Matti Barton left, Nicole Kukura right, analyzing a shot gather image of the seismic waveforms recorded by 24 geophone receivers on a laptop. Seismic waves are generated by hitting a sledgehammer on the ground which triggers the laptop’s software to save the amplitude of seismic vibrations for a specified duration of 2 seconds.
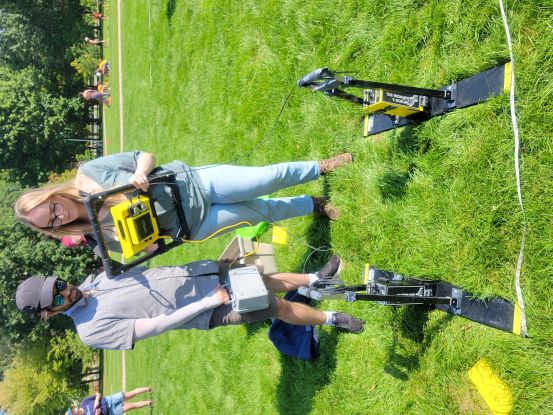
Mahmoud Bagheri left, Gillian Noonan right, seen operating the PulseEKKO Pro with 100 MHz antennae to perform a Ground Penetrating Radar (GPR) survey, a method that uses electromagnetic radar pulses to create an image of the subsurface. These radar pulses are reflected off of subsurface anomalies and sent back to a receiver where travel time is measured to determine the radar wave velocity. This allows for a subsurface image of electrical layers in the ground to be generated. Strong radar reflections occur due to increased water content and electrical conductivity of the ground.
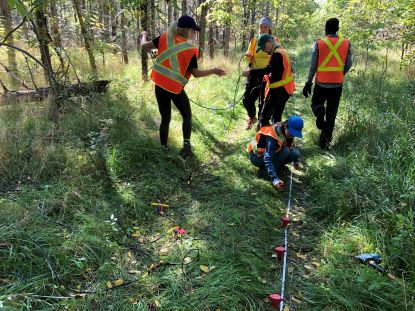
Left to right: Nicole Kukura, Saralyn Smith,
Sanaz Darzipour, Matti Barton, Nasir Maiauduga
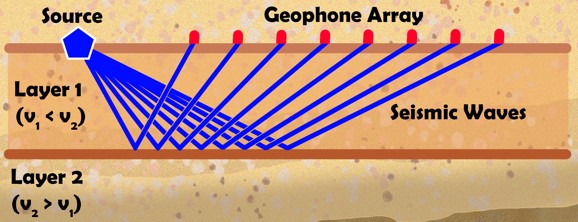
Five students are pictured setting up a geophone array. A geophone array consists of a series of acoustic (seismic) detectors arranged in a line to measure the arrival time of seismic waves between detectors and along the array’s length, as shown below. The arrival times of these vibrations are used to determine the seismic wave speeds of the subsurface ground to interpret its geologic layering.
Acknowledgements
This display was created by work-study student Ezra Hovi with guidance from Dr. Alysha McNeil. Display set up by Olivia Benest and Dr. Alysha McNeil. Thank you to Dr. Bob Mereu for all of his help identifying these pieces of equipment, and providing some of their history in the department. Thank you to Dr. Sheri Molnar for providing the student photos, and feedback on the poster text and design.