May 21 derecho update #2 of 2: EF-scale contour map
NTP has put together an exhaustive collection of observations from the May 21 derecho affecting southern Ontario and Quebec, and has completed a preliminary intensity analysis using EF-scale contours. The losses for this historic derecho are now approaching (or may be over) 1 billion CAD.
It should be noted that a derecho is not on its own an individual storm (i.e. one cannot say that 'the derecho is moving rapidly'). It's defined as a family of particularly damaging downburst clusters produced by a mesoscale convective system (MCS), according the AMS Glossary. The MCS is rapidly moving, long lived and produces widespread wind damage over its lifetime. The MCS and the downbursts it generates over its lifetime can be called a derecho if they meet certain criteria (the AMS Glossary states that damage must be incurred either continuously or intermittently over a swath of at least 650 km and a width of approximately 100 km or more).
In the case of the May 21 derecho, the first damage was recorded in northern Ohio followed by southeastern lower Michigan. The first damage on the Canadian side of the border occurred near Wallaceburg, and continuous damage began as the MCS arrived at Glencoe. The continuous damage did not stop until the MCS passed Montreal. Near that time, new storms that had developed over upstate New York and northwest Vermont were becoming organized along the north-south axis of the MCS and generating wind damage that would continue into Maine. From the first damage location to the last, the length is approx. 1200 km, far exceeding the minimum length requirement for a derecho. The maximum width of the damage swath through Canadian territory is just under 100 km at 95 km. But when combined with the damage area in the US near the end of the lifetime of the MCS, the maximum width exceeds 250 km. The gap between these areas is likely a peculiarity of the derecho location, with a dampening of MCS intensity downstream of relatively cool surface of Lake Ontario.
Below are various maps that show the extent of the derecho, the EF-scale contours, and various observations including those that were used to define the damage areas and intensity.
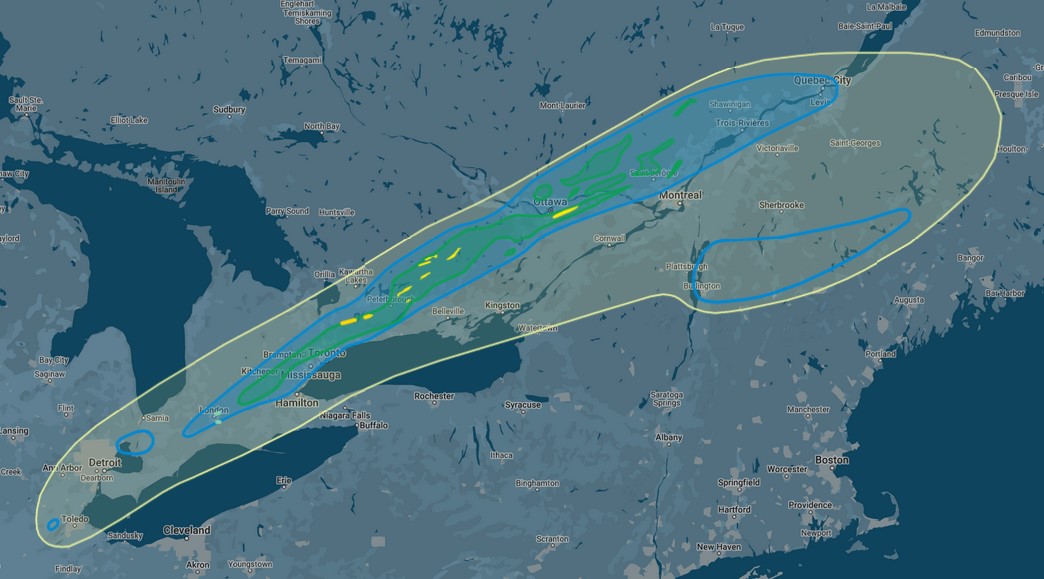
Map showing EF-scale contours for the derecho damage (blue = EF0, green = EF1, yellow = EF2) and well a light yellow contour that represents the edges of the MCS's radar reflectivity. The damage areas that are not part of the continuous damage path have an outline only and no fill. EF1 tornadoes in the London area are shown as light green lines and the EF2 tornadoes at Uxbridge and St. Christopher are shown as dark yellow lines.
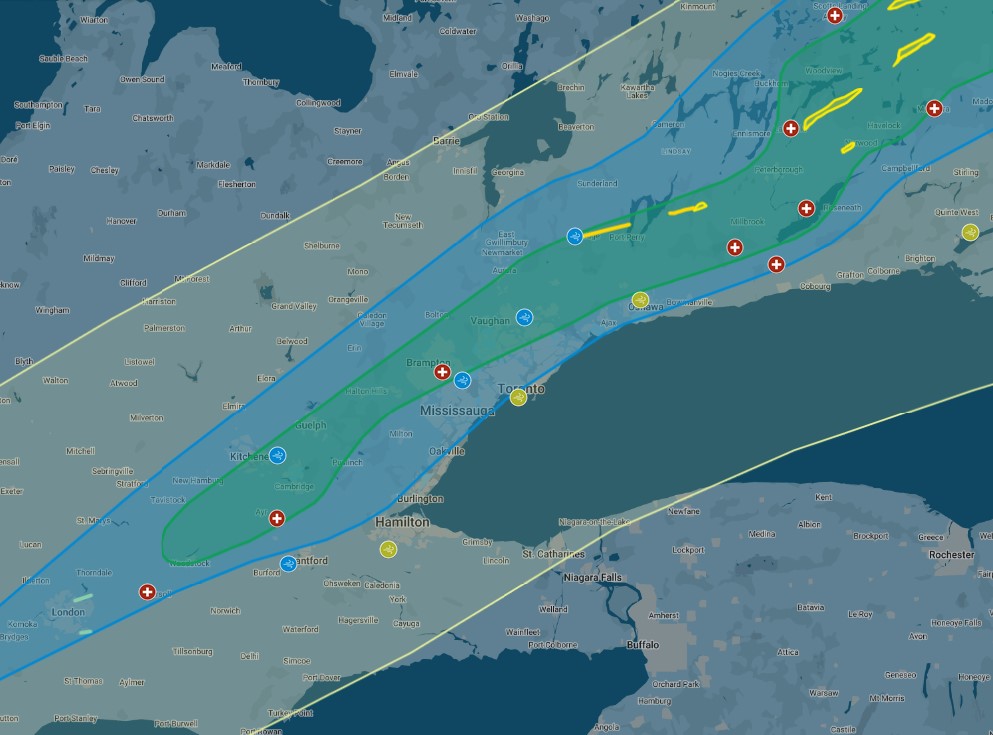
The western (top)and eastern (bottom) portions of the derecho contour map with locations of observed wind speeds plotted (gold = below 90 km/h, blue = 90-130 km/h) and the locations of storm casualties plotted (red circles with white crosses). EF1 tornadoes in the London area are shown as light green lines and the EF2 tornadoes at Uxbridge and St. Christopher are shown as dark yellow lines.
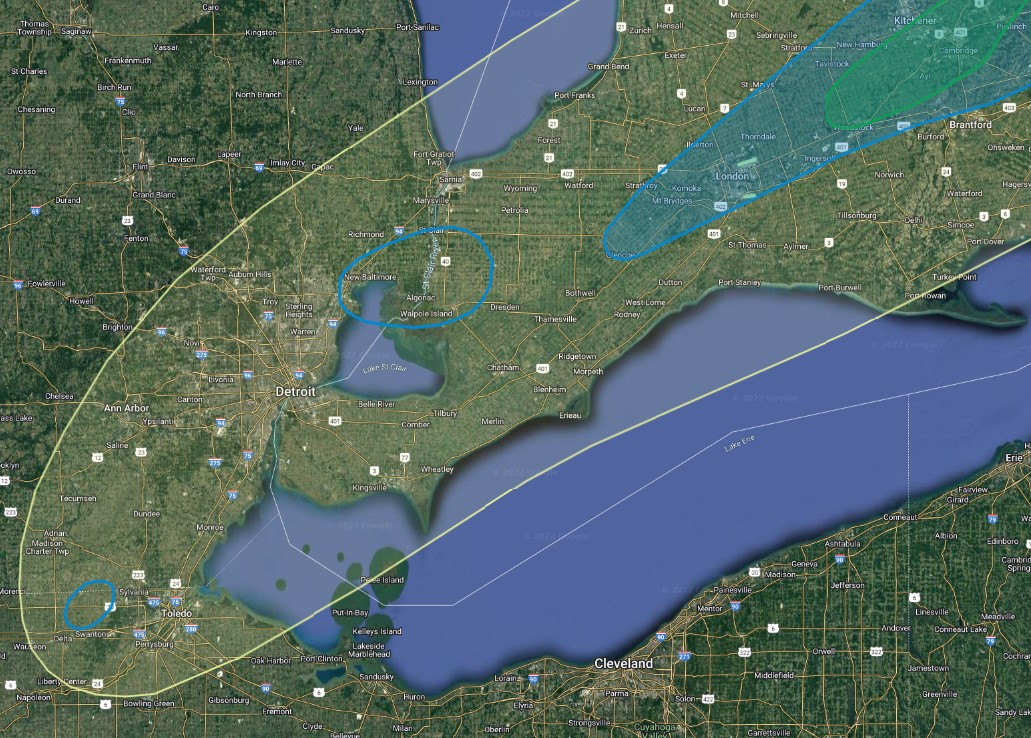
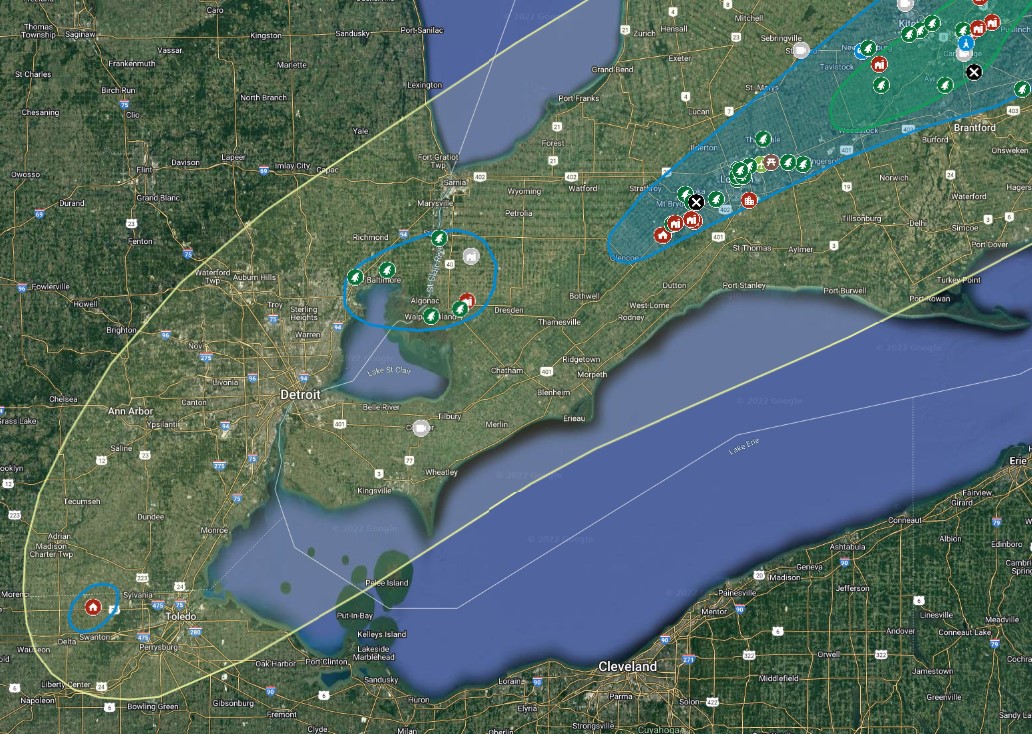
A zoomed contour map for the derecho in OH, MI and southwestern ON with damage reports and satellite-derived damage locations (circle with X) plotted at bottom. The EF1 tornadoes in the London area are shown as light green lines.
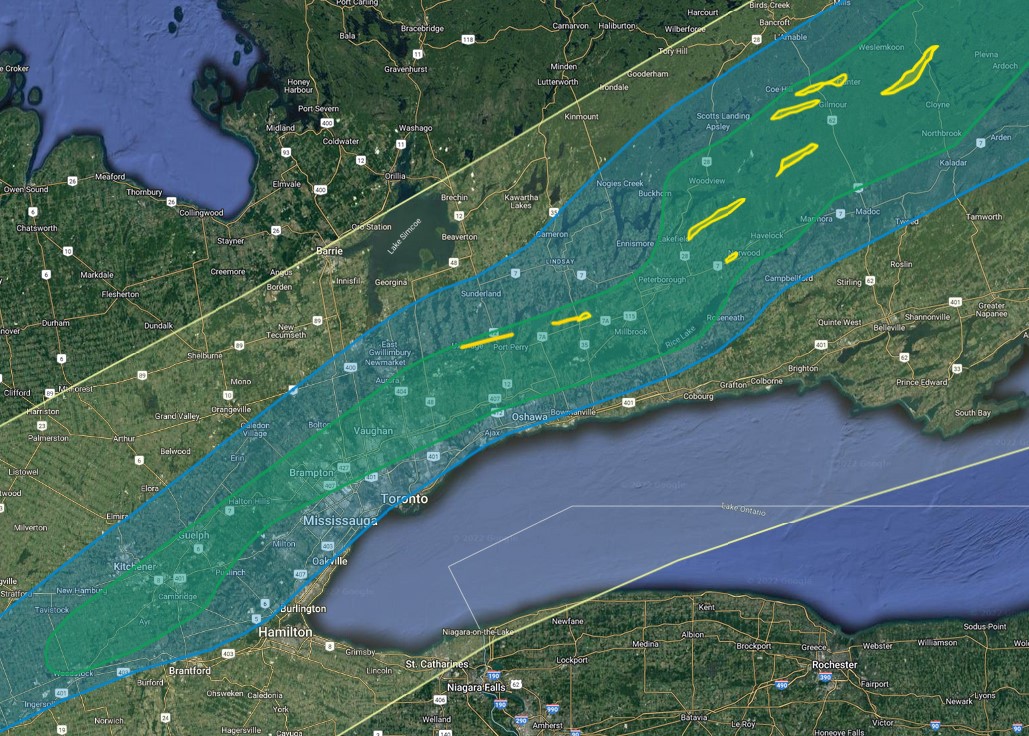
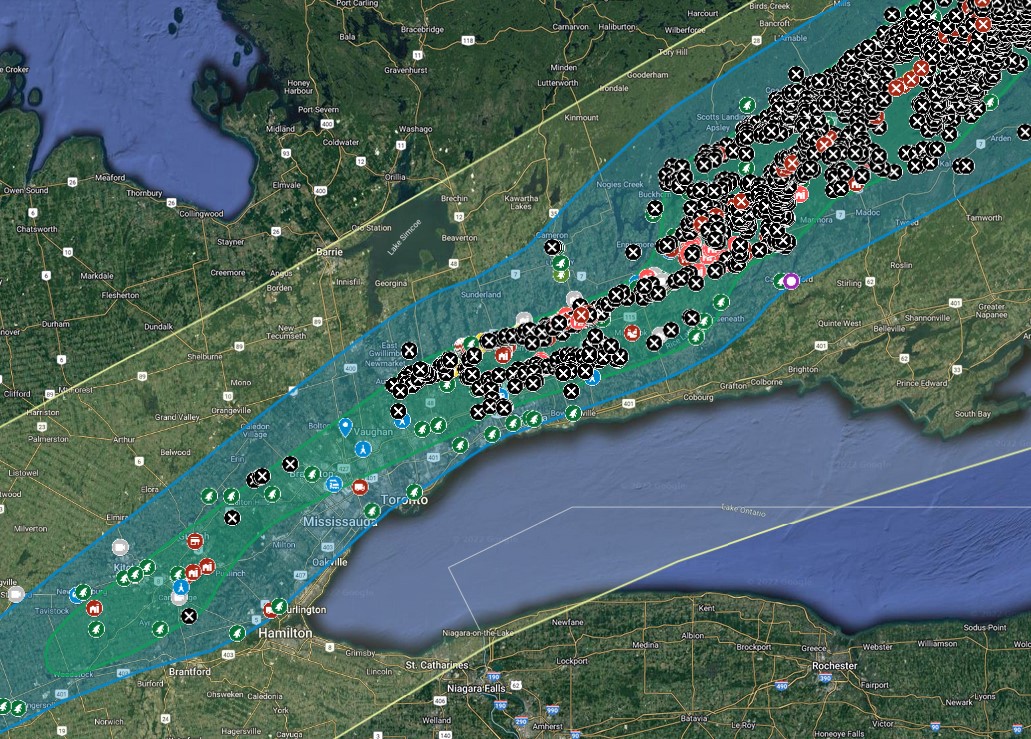
A zoomed contour map for the derecho in central parts of southern ON with damage reports and satellite-derived damage locations (circle with X, red = extensive tree damage) plotted at bottom. Purple circles are hail reports (blue if sig svr hail). The EF1 tornadoes in the London area are shown as light green lines and the EF2 tornadoes at Uxbridge and St. Christopher are shown as dark yellow lines.
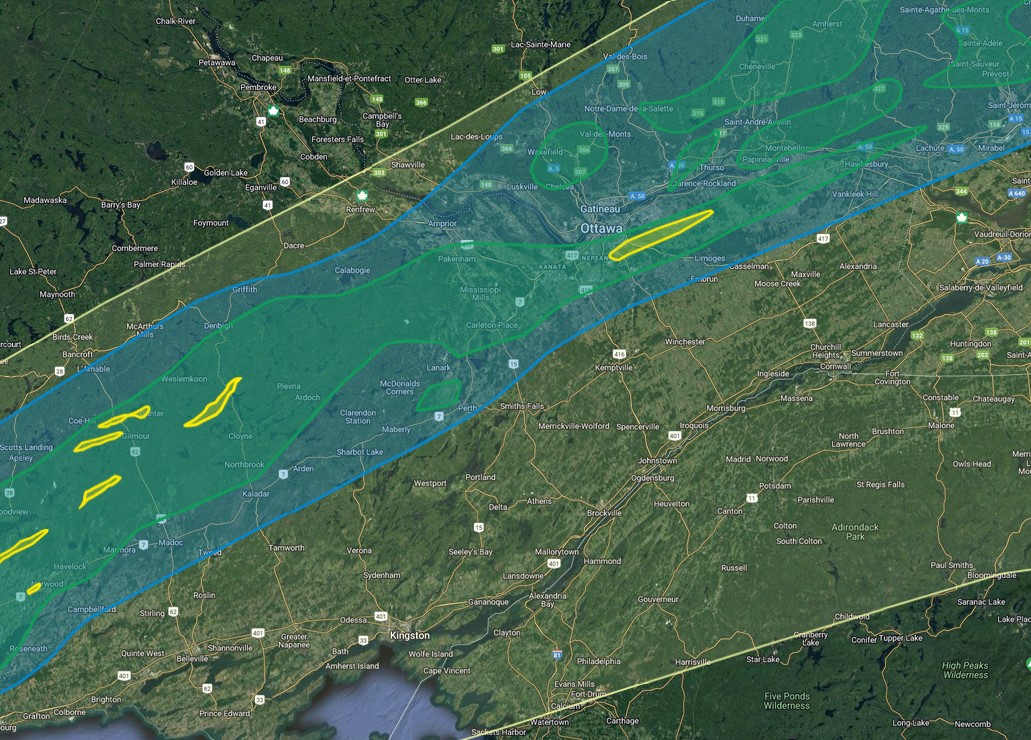
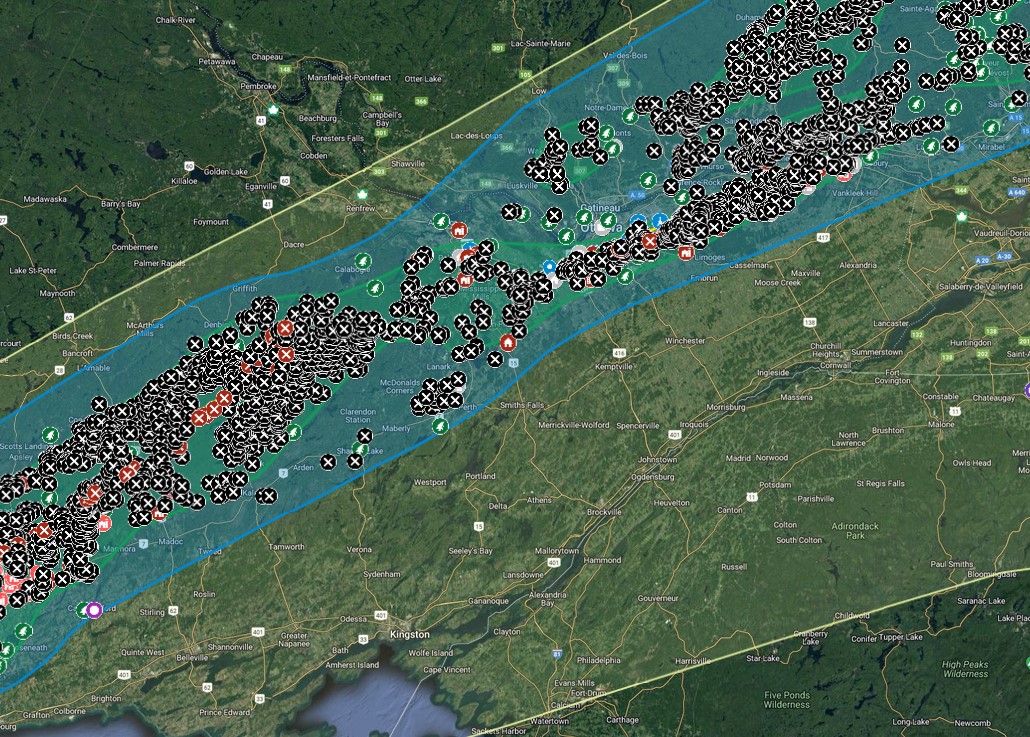
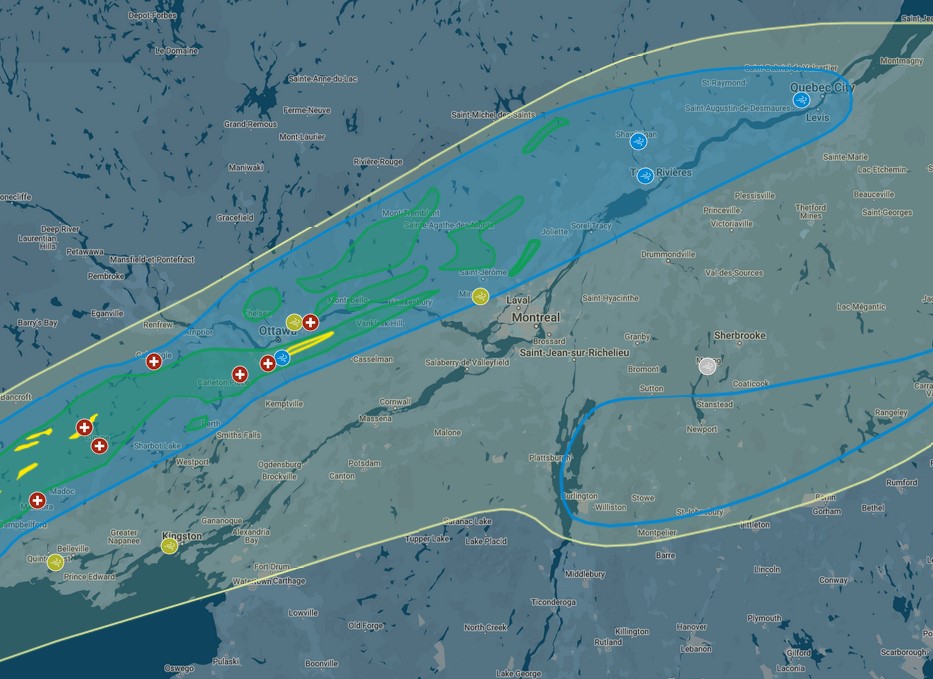
A zoomed contour map for the derecho in eastern ON with damage reports and satellite-derived damage locations (circle with X, red = extensive tree damage) plotted at bottom. Purple circles are hail reports (blue if sig svr hail). The EF2 tornadoes at Uxbridge and St. Christopher are shown as dark yellow lines.
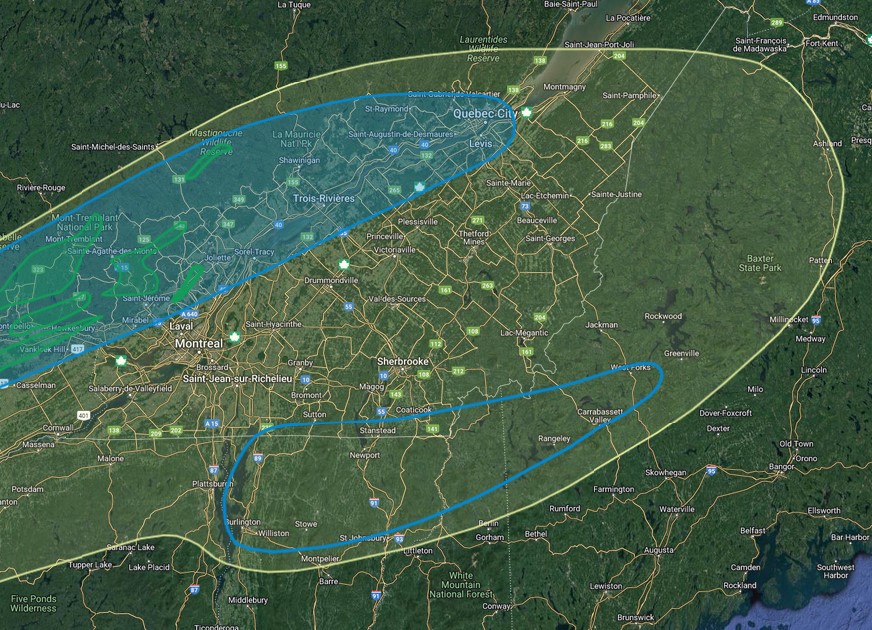
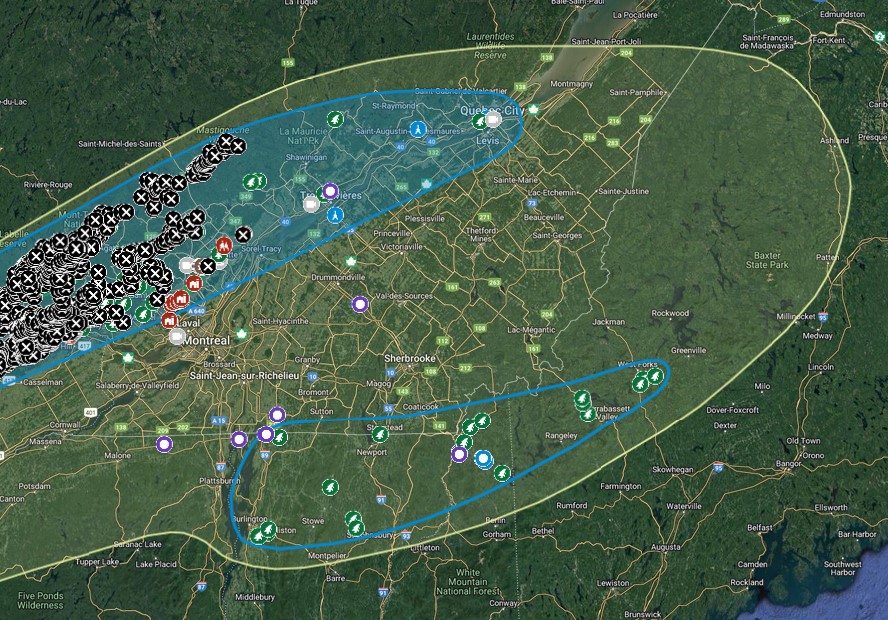
A zoomed contour map for the derecho in eastern ON, southern QC and parts of US New England with damage reports and satellite-derived damage locations (circle with X, red = extensive tree damage) plotted at bottom. Purple circles are hail reports (blue if sig svr hail).