NTP Tornado Warning Performance Assessment
It's Emergency Preparedness Week across Canada - and for good reason. It's spring again and that means the start of the severe weather season, including the threat of tornadoes.
NTP has undertaken a preliminary independent assessment of tornado warning performance in Canada, covering the years 2019 to 2021. What follows is a 'report card', followed by a guide for interpreting the report card, and then the detailed performance assessment. A final assessment is anticipated with the publication of the study in a peer-reviewed journal in the coming months. Overall, the goal of this initiative is to help improve both tornado warning performance in Canada and the understanding of tornado warning issues in the Canadian context.
Thanks for reading and please continue on below.
Dr. David Sills, NTP Executive Director
Report Card Background Information and Interpretation
Environment and Climate Change Canada (ECCC) has the federal mandate for issuing severe weather watches and warnings across Canada. Their national alerting performance targets are as follows:
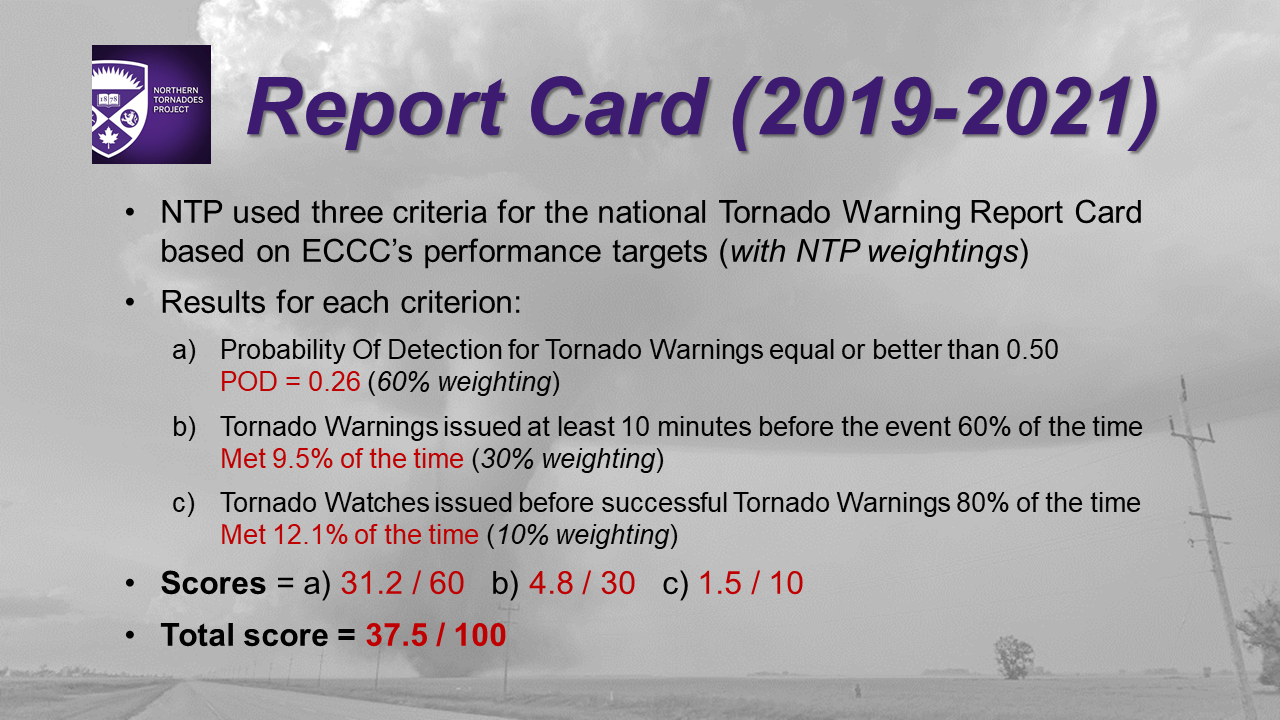
* "Probability Of Detection for Tornado Warnings equal or better than 0.50",
* "Tornado Warnings issued at least 10 minutes before the event 60% of the time",
* "Convective Watches issued at least 6 hours before the events 80% of the time", and
* "Probability Of Detection for Convective Watches equal or better than 0.65".
Note that 'convective' here means related to thunderstorms - so 'Convective Watches' refers to both severe thunderstorm watches and tornado watches. The NTP assessment however focuses mainly on tornado warnings.
The following is interpretation information for each of NTP's three Report Card criteria:
- The Probability of Detection (POD) answers the question, “What fraction of all tornadoes documented over the period had a tornado warning?” The ideal score here is 100%, but ECCC has chosen a target of 50%, or 0.5. Based on the 2019-2021 data, the calculated POD for all tornadoes is 0.26 (or 26%). The POD is slightly better when considering only tornadoes that occurred within the Doppler range of radars (0.28) and considerably better when considering only tornadoes rated EF2 or higher on the EF scale (0.38, though the sample size is small at only 40 tornado events). The best POD value (0.40) was found for supercell-type tornadoes. It is important to note here that nearly all violent (EF4-EF5) tornadoes are supercell tornadoes, and nearly all tornado-related fatalities are caused by tornadoes rated EF2 or higher. Because the POD deals with whether a tornado was warned or not, this criterion was given the highest weighting by NTP: 60% of the total score.
- Ideally, for 100% of tornadoes, tornado warnings should give those affected enough time to take protective action. Here, ECCC has chosen to use a target of 10 minutes of warning lead time, for 60% of tornadoes. Using the 2019-2021 data, NTP found that this target was met 9.5% of the time. The percentage of tornado events meeting this target is slightly higher when considering only tornadoes that occurred within the Doppler range of radars (10.4%) and only EF2+ tornadoes (12.5%). NTP has given this criterion a weighting of 30% because while lead time is secondary to whether a warning was issued it is still important that those affected have enough time to take safety precautions.
- A tornado watch is a type of ‘Convective Watch’ that is issued by ECCC. For events where a tornado is confirmed, NTP considers the optimal progression to be: 1) tornado watch issued for area, then 2) tornado warning issued for area, and finally 3) tornado occurs in area. The ECCC target of a tornado watch being issued six hours prior to the event 80% of the time was relaxed by NTP because the 6-hour threshold was met for only two tornado events, and having a tornado watch out for even an hour before a tornado warning aids with the public alerting process. Using the 2019-2021 data, NTP found that this relaxed target was met 12.1% of the time. The focus of our assessment is on tornado warnings, so this criterion was assigned only a 10% weighting.
Adding up the weighted scores for the three criteria gives the total score out of 100: 37.5, or a failing grade.
Details related to the calculation of POD and lead time are discussed in the detailed assessment that follows.
NTP Preliminary National Tornado Warning Performance Assessment
Introduction
In the spirit of improving tornado alerting effectiveness for all Canadians, the Northern Tornadoes Project (NTP) has undertaken the first independent assessment of tornado warning performance in Canada. We used NTP tornado data and ECCC tornado warnings over the period 2019 to 2021 to assess warning accuracy and timeliness. We were also able to obtain US National Weather Service tornado warning performance data for states that border Canada, and compare. There are a number of different ways to improve tornado warning performance, and NTP makes several key recommendations near the end of the assessment.
Assessment Data
For tornado data, we used NTP-confirmed tornadoes over land from 2019 to 2021 (N=221). Start times were investigated and obtained for each tornado event. These should be the same tornado events that are in ECCC's records since NTP confirmations are discussed with ECCC each season to ensure agreement.
For tornado warnings, we used the official ECCC tornado warnings that were the initial warning for that region (N=263), obtained via NTP partner Instant Weather. All related ECCC watches and advisories were also obtained.
Methods
We wanted to try to keep the assessment simple so took an 'all of Canada' approach, combining the data from all regions of the country. We then employed the widely used contingency table model to calculate the Probability of Detection (POD), the False Alarm Ratio (FAR), the Critical Success Index (CSI) and the Bias. These parameters tell us the following:
POD – What fraction of tornadoes were correctly tornado-warned? (0 is worst, 1 is best)
FAR – What fraction of tornado-warned events were false alarms? (1 is worst, 0 is best)
CSI – How well did the tornado warnings correspond to confirmed tornadoes? (0 is worst, 1 is best)
Bias – Over-warning (>1) versus under-warning (<1) (1 is best)
We used a somewhat relaxed but realistic definition of a tornado warning success or 'hit': the tornado warning had to be issued before, during, or within 10 minutes from the start of the tornado event. This covers a large number of scenarios, including that in which a spotter reports a tornado to ECCC but the weak, brief tornado has dissipated by the time the warning is broadcast (we thought 10 minutes was fair). This extra time allowance should not be a factor for stronger, longer-lived tornadoes that often have a lifetime beyond 10 minutes.
When dealing with multiple tornado events, we considered one tornado warning for a region with three tornadoes in it as three separate hits.
The National Weather Service (NWS) in the US uses slightly different calculations for FAR and CSI, so all comparisons to US statistics use NWS calculations.
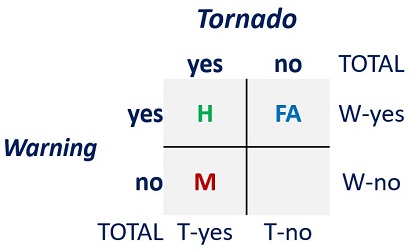
A contingency table for tornadoes and tornado warnings
with the hits (H), misses (M) and false alarms (FA) that
are used to calculate POD, FAR, CSI and Bias.
And here are the calculations: POD = H/(H+M), FAR = FA/(H+FA), CSI = H/(H+M+FA), Bias = (H+FA)/(H+M).
Assessment Results
The following images show the contingency tables and parameter values for each year from 2019 to 2021 considering all tornadoes.
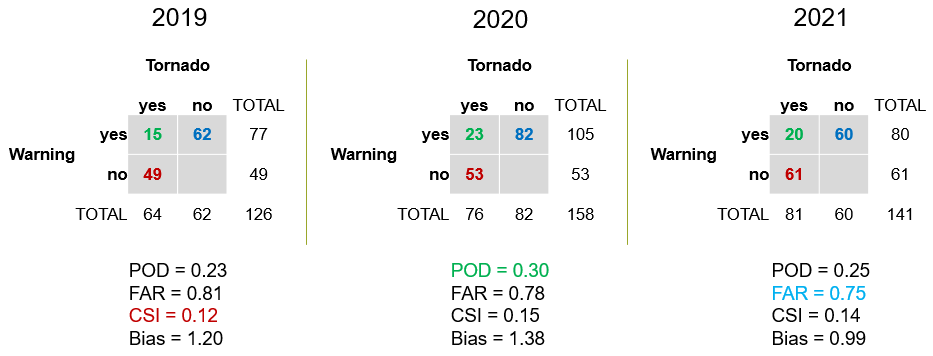
We note some of the outliers here - the CSI was relatively low in 2019, the POD the relatively high in 2020 and the FAR was relatively low in 2021. The Bias showed that, except for 2021, there was slight over-warning.
The next image shows the contingency table and parameter values when data from 2019 to 2021 are combined, again considering all tornadoes.
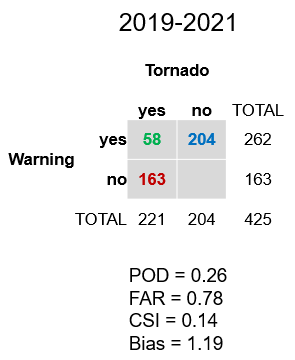
We can look at POD results in a number of ways. For example, is the POD better when the area of interest is confined to the Doppler domain of the radar coverage, since that is where storm rotation signatures can be detected? For tornadoes occurring within Doppler range the POD is 0.28 - so not much higher than for all tornadoes (0.26).
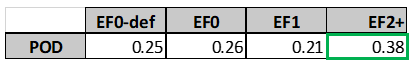
Below are the POD values by EF-scale ranking (below). The table shows that the POD does not change much between tornadoes rated EF0, EF1 or having a default EF0 ranking (i.e., no damage was found). But for EF2+ tornadoes, the POD does increase consideably to 0.38 (green box). Many EF2+ tornadoes are generated by supercell thunderstorms (that often have a rotation signature on radar), while very few if any are landspout-type tornadoes (where the parent thunderstorm has no rotation apparent on radar). The EF2+ sample size is small, however, at only 40 tornadoes.
We can also compare the POD values for different tornado types. The NTP FAQ defines three types of tornadoes: supercell, quasi-linear convective system (QLCS) and landspout. Typically, supercell storms produce the strongest tornadoes, up to the top of the EF scale at EF5. Landspout tornadoes form with loosely organized storms and therefore typically produce weak damage, EF0 to EF1 on the EF scale. QLCS tornadoes occur along the leading edge of a line of storms and are typically stronger and longer-lived than landspout tornadoes, though not quite up to the level of supercell tornadoes.
As was mentioned earlier, landspout tornadoes rarely have an identifiable signature on radar, and are often brief, making them the hardest to warn for. Other the other hand, supercell thunderstorms often have prominent, long-lived features that are easy to see on radar, and they occur in a dynamic environment that can sometimes be forecast days in advance. That makes it (generally) easier to anticipate supercell tornadoes.
It is not always so cut-and-dried when it comes to tornado type, however. In some cases, the tornado is a combination of types - what we call 'hybrid' tornadoes.
The tornado type was subjectively determined for each tornado using (where available) radar imagery, lightning data, surface weather analysis maps, storm environment information, and visual characteristics of the parent storm. The number of tornadoes, percentage of total tornadoes, and POD for each tornado type are as follows:
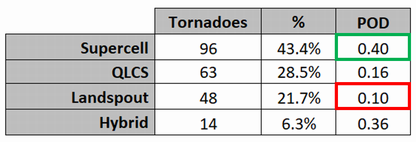
The POD is considerably higher for supercell tornadoes (0.40, green box), which also make up the largest proportion of tornadoes in the study. The POD for hybrid tornadoes is also relatively high, due to the fact that many of the hybrid cases involve supercell processes. For landspouts, the POD is lowest at only 0.10 (red box).
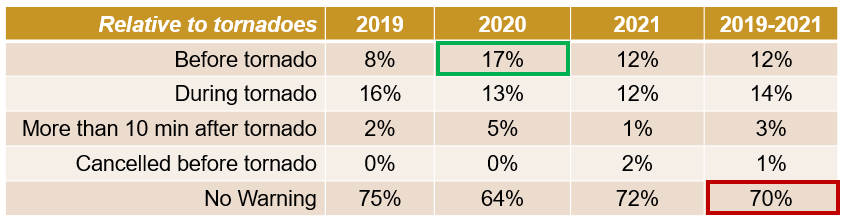
The next table shows when tornado warnings were issued relative to the recorded tornado event start times. A reminder here that the first two rows would be considered hits in our assessment. A relatively higher number of tornado warnings were issued before the tornado events in 2020 (green box). But overall, a full 70% of tornadoes had no tornado warning issued at all (red box).
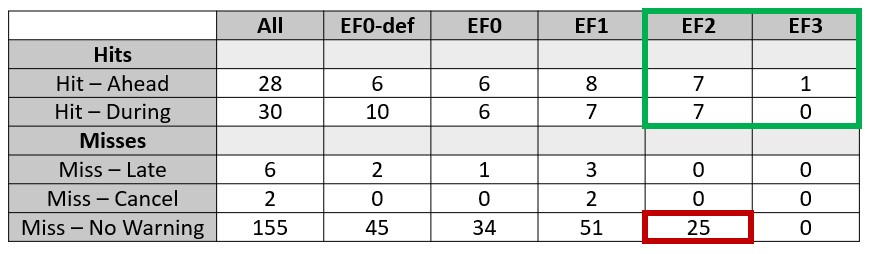
We can also examine the lead time aspect of tornado warnings by EF scale, as seen in the table below. Again, it can be seen that for EF2+ tornadoes, there are more hits (green box) and fewer misses than for weaker tornadoes. However, there were still 25 EF2 tornadoes that had no tornado warning (red box).
It is difficult to get a sense of the level of performance using all of these values without something to compare them to. In the next section we will do that.
Comparison to National Weather Service Tornado Warning Performance
To put these tornado warning performance values into context, we compare them here to US NWS tornado warning performance values in two ways. First, using US national values compiled by Brooks and Correia (2018), and second, via a more direct comparison - using only data from states in the contiguous US bordering Canada over the same 2019-2021 period.
Before making the comparisons, it should be stated that it is not exactly 'apples to apples'. The NWS has many more forecasters watching radars and issuing tornado warnings. In fact, NWS forecasters can often focus on just the one radar that their office is responsible for and are therefore typically less dependent on automated storm feature and ranking algorithms. NWS radars are also optimized for tornadic storm detection, and can scan more quickly in severe storm situations (every 1-2 minutes). Lastly, tornado watches are not issued by local NWS offices, but instead by a national Storm Prediction Center. Though there are these differences, we can still learn from the US experience with tornado warnings.
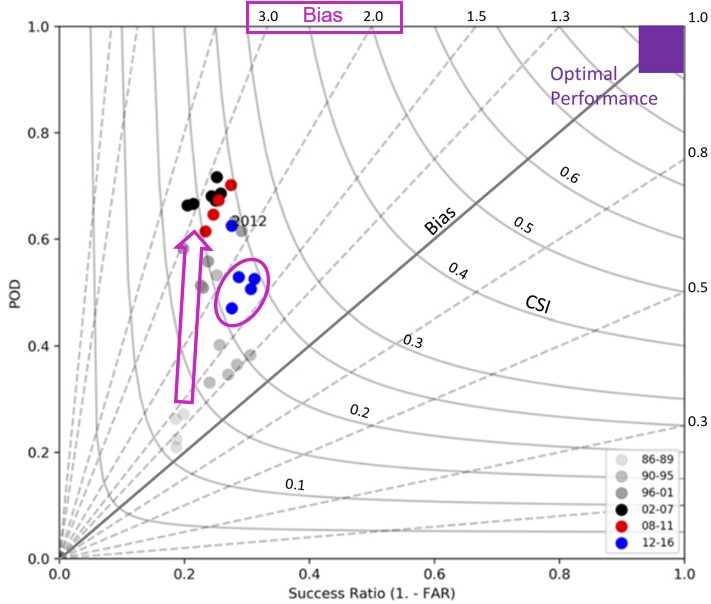
Something else that needs to be discussed in order to understand the comparison is the 'performance diagram' and what it tells us. A performance diagram is able to show values of POD, FAR, CSI and Bias all in one chart. It looks rather complicated, but the key to understanding the diagram is that performance improves towards the top right.
So, with these things in mind, let's compare.
The annotated performance diagram below is from Brooks and Correia (2018) and shows NWS tornado warning performance as it evolved from 1986 (light grey) to 2016 (blue). From 1986 to 2007, the NWS increased their national tornado warning performance by sharply increasing the Bias (from near 1 to near 3) while keeping the FAR relatively steady near 0.8. In doing so, the POD increased dramatically from near 0.2 to over 0.6, resulting in an increase in CSI from near 0.1 to 0.2. The latest points on the chart from 2012-2016 (blue) show that the NWS then managed to retain the same CSI and a relatively high POD while reducing Bias and FAR - moving closer to 'optimal performance' at top right.
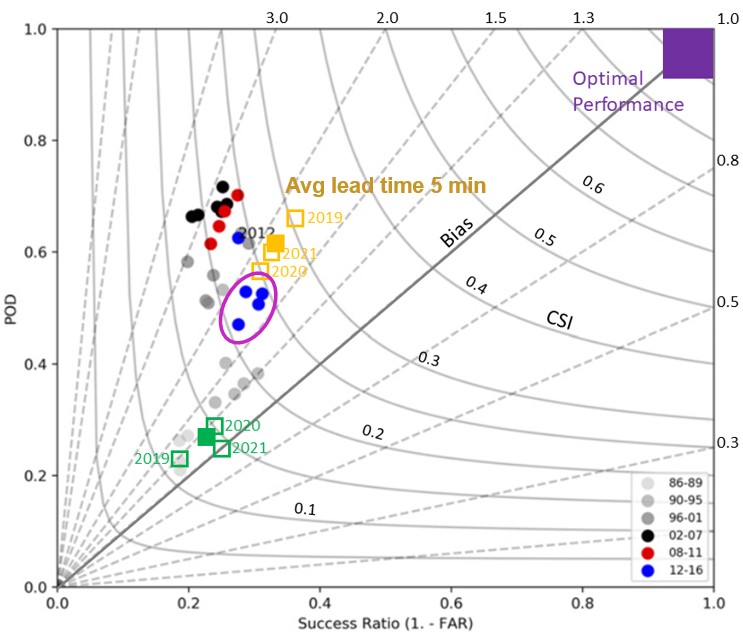
We then add more data and annotations to the performance diagram below. Tornado warning performance data from the US border states for 2019 to 2021 (open gold squares) and the combined data for 2019 to 2021 (solid gold square) are shown, as is their average warning lead time over that period (5 minutes). It can be see here that the tornado warning performance is even better (towards top right) here than for all of the US in the 2012-2016 period (blue). ECCC tornado warning performance data are added in the same fashion but in green. Interestingly, the ECCC tornado warning performance over the past three years, including all tornadoes, is where NWS national tornado warning performance was in the late 1980's / early 1990's. And the overall ECCC CSI near 0.14 is considerably lower than the overall NWS border state CSI near 0.27. Finally, it is noteworthy that the NWS Bias is near 2.0 (considerable over-warning) while the ECCC Bias is closer to 1.2.
NTP Recommendations
Based on our independent assessment of ECCC tornado warning performance, it is clear that improvements are needed. And the NWS experience in the US suggests a possible way forward. NTP recommends the following actions in order to begin to increase tornado warning performance in Canada.
1) Increase the number of tornado warnings, as was done by NWS (resulting in a higher Bias). This should lead to an increased POD, and CSI. The challenge would be to do this in a way that would not significantly increase FAR. However, the latest research suggests that concerns about false alarms may be overblown, showing no clear evidence that false alarms – perceived or actual – generate a complacent public (Lim et al. 2019). That is, tornado misses – particularly for high-impact events – have a much greater negative impact than a high FAR. In fact, false alarms and FAR are not mentioned at all in ECCC's performance targets.
2) Increase lead times by finding ways to get tornado warnings out sooner. Many times forecasters are waiting for one more scan from the radar, or cues from public reports, to feel confident enough to issue a tornado warning. Confidence is certainly a key issue - and can be increased through highly focused and ongoing training (particularly via simulations since tornadoes are relatively rare events and it is difficult to quickly gain sufficient experience). There needs to be high proficiency with recognizing both weather patterns favourable for tornadic storms and storm features on radar indicating tornado potential (or occurrence). High proficiency results in the confidence required to issue a warning before a storm produces a tornado, not after its occurrence has become obvious.
3) Ensure forecasters have cutting-edge tornado detection, nowcasting and forecasting tools. Having forecaster-friendly algorithms and applications that use the latest science and technology to highlight the tornado threat - in the next six minutes, the next several hours or the next several days - is key to being prepared to issue a tornado warning (or tornado watch). In Canada, we often rely on sophisticated US tools for this, but those tools typically do not cover all of Canada's tornado prone regions. In the near future, NTP and its partners will be developing radar-related techniques and tools to enhance the detection and nowcasting of tornadic storms, and we hope to work collaboratively with ECCC toward this goal.
Summary
NTP has completed the first independent assessment of tornado warning performance in Canada, covering the period from 2019-2021. The main results are:
* The Probability of Detection for ECCC's tornado warnings is much less than their target of 0.5 - though it comes closer for EF2+ tornadoes,
* Only 12% of tornadoes were preceded by a tornado warning while 70% of tornadoes had no tornado warning at all - though again results are better for EF2+ tornadoes, and
* There is a need for more and earlier tornado warnings (through improved forecaster confidence), and forecaster-friendly tools for the detection, nowcasting and forecasting of tornadic storms that incorporate the latest science and technology.
Acknowledgements
NTP's Lesley Elliott did the bulk of the data analysis for this assessment. NWS's Dr. Greg Mann provided US NWS tornado warning performance data for the states bordering Canada. Thanks to several MSC staff for providing feedback on earlier versions of the assessment.
References
Brooks, Harold E. and James Correia Jr., 2018: Long-Term Performance Metrics for National Weather Service Tornado Warnings. Wea. Forecasting, 33, 1501–1511. https://doi.org/10.1175/WAF-D-18-0120.1
Lim, JungKyu R., Brooke F. Liu and Michael Egnoto, 2019: Cry Wolf Effect? Evaluating the Impact of False Alarms on Public Responses to Tornado Alerts in the Southeastern United States. Wea. Clim. & Soc., 11, 549-563. https://doi.org/10.1175/WCAS-D-18-0080.1