2022 Tornado Warning Performance Assessment
Last spring, NTP undertook the first independent assessment of tornado warning performance in Canada, covering the years 2019 to 2021. It included a 'report card' and the details of the performance assessment (see here). Overall, the goal of the initiative is to help improve both tornado warning performance in Canada and the understanding of tornado warning issues in the Canadian context.
Below is our annual report card and detailed performance assessment, this time for the 2022 season. We’re happy to report that scores have improved somewhat, going from an overall failing grade over the 2019-2021 period to a passing grade in 2022.
Note that results from both 2021 and 2022 will be formally published and only then considered 'final'.
Dr. David Sills
NTP Executive Director
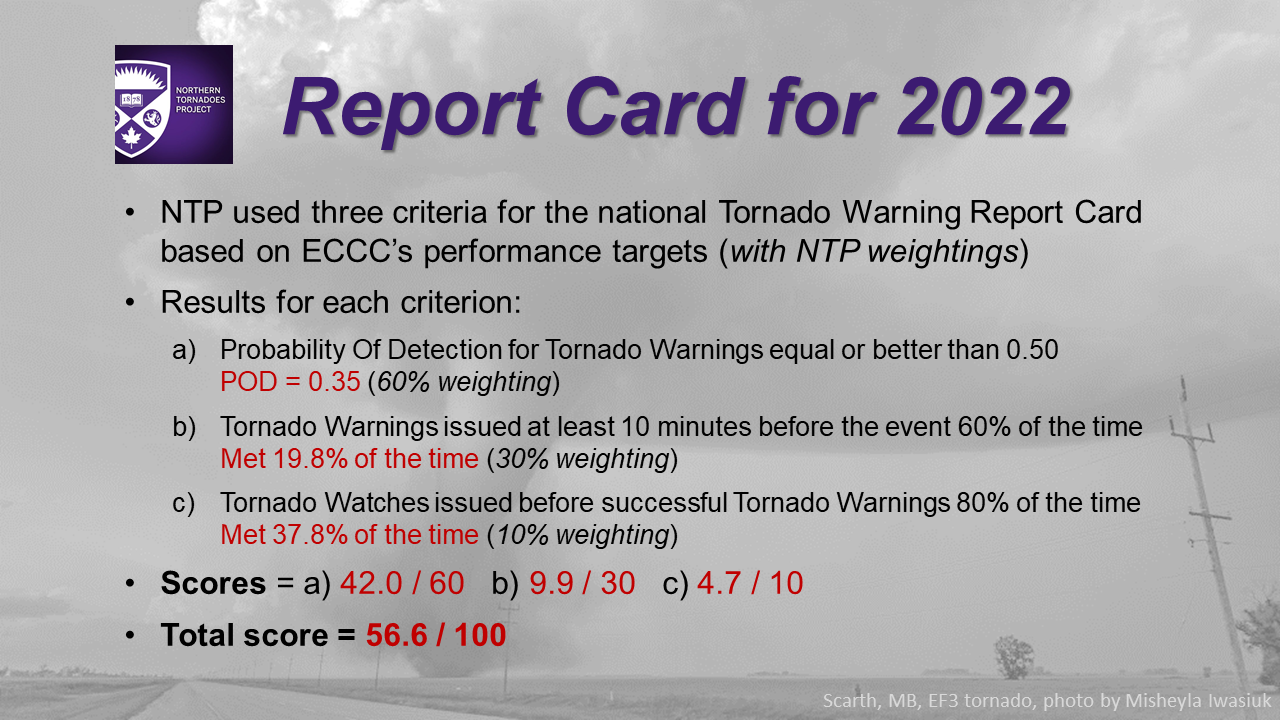
The following is NTP's tornado warning 'report card' for 2022:
Report Card Background Information and Interpretation
Environment and Climate Change Canada (ECCC) has the federal mandate for issuing severe weather watches and warnings across Canada. Their national alerting performance targets are as follows:
* "Probability Of Detection for Tornado Warnings equal or better than 0.50",
* "Tornado Warnings issued at least 10 minutes before the event 60% of the time",
* "Convective Watches issued at least 6 hours before the events 80% of the time", and
* "Probability Of Detection for Convective Watches equal or better than 0.65".
Note that 'convective' here means related to thunderstorms - so 'Convective Watches' refers to both severe thunderstorm watches and tornado watches. The NTP assessment however focuses mainly on tornado warnings.
The following is interpretation information for each of NTP's three Report Card criteria:
- The Probability of Detection (POD) answers the question, “What fraction of all tornadoes documented over the period had a tornado warning?” The ideal score here is 100%, but ECCC has chosen a target of 50%, or 0.5. Based on the 2022 data, the calculated POD for all tornadoes is 0.35 (or 35%). The POD is slightly better when considering only tornadoes that occurred within the Doppler range of radars (0.38) but slightly worse when considering only tornadoes rated EF2 or higher on the EF scale (0.33, though the sample size is small at only 30 tornado events). The best POD value (0.39) was found for supercell-type tornadoes. Note that nearly all violent (EF4-EF5) tornadoes are supercell tornadoes, and nearly all tornado-related fatalities are caused by tornadoes rated EF2 or higher. Because the POD deals with whether a tornado was warned or not, this criterion was given the highest weighting by NTP: 60% of the total score.
- Ideally, for 100% of tornadoes, tornado warnings should give those affected enough time to take protective action. Here, ECCC has chosen to use a target of 10 minutes of warning lead time, for 60% of tornadoes. Using the 2022 data, NTP found that this target was met 19.8% of the time. The percentage of tornado events meeting this target is slightly higher when considering only tornadoes that occurred within the Doppler range of radars (21.6%). NTP has given this criterion a weighting of 30% because while lead time is secondary to whether a warning was issued it is still important that those affected have enough time to take safety precautions.
- A tornado watch is a type of ‘Convective Watch’ that is issued by ECCC. For events where a tornado is confirmed, NTP considers the optimal progression to be: 1) tornado watch issued for area, then 2) tornado warning issued for area, and finally 3) tornado occurs in area. The ECCC target of a tornado watch being issued six hours prior to the event 80% of the time was relaxed by NTP because the 6-hour threshold was met by so few events, and having a tornado watch out for even an hour before a tornado warning aids with the public alerting process. Using the 2022 data, NTP found that this relaxed target was met 37.8% of the time. The focus of our assessment is on tornado warnings, so this criterion was assigned only a 10% weighting.
Adding up the weighted scores for the three criteria gives the total score out of 100: 56.6, or a passing grade (a ‘D’).
Details related to the calculation of POD and lead time are discussed in the detailed assessment that follows.
NTP Preliminary National Tornado Warning Performance Assessment
Introduction
In the spirit of improving tornado alerting effectiveness for all Canadians, the Northern Tornadoes Project (NTP) conducts annual independent assessments of tornado warning performance in Canada. We used NTP tornado data and ECCC tornado warnings over the previous tornado season to assess warning accuracy and timeliness. There are a number of different ways to improve tornado warning performance, and NTP provides recommendations near the end of the assessment.
Assessment Data
For tornado data, we used NTP-confirmed tornadoes over land from 2022 (N=106). Start times were investigated and obtained for each tornado event. These are the same tornado events that are in ECCC's records since NTP confirmations are discussed with ECCC each season to ensure agreement.
For tornado warnings, we used the official ECCC tornado warnings that were the initial warning for that region (N=181), obtained via NTP partner Instant Weather. All related ECCC convective watches, warnings and advisories were also obtained.
ECCC does issue other warnings and advisories that mention the possibility of a tornado. Severe thunderstorm warnings can contain the phrase, “Remember, severe thunderstorms can produce tornadoes”. Also, weather advisories for funnel clouds indicate the possibility of “a weak landspout tornado”. However, in both cases, these ‘tornado tags’ are used far more often than tornadoes actually occur. For example, in 2022, 1660 severe thunderstorm warnings used the tornado tag, which is 43% of all severe thunderstorm warnings issued.
Methods
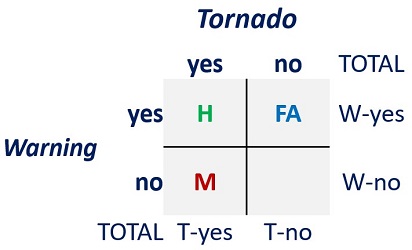
To keep the assessment simple, we take an 'all of Canada' approach, combining the data from all regions of the country. We then employ the widely used contingency table model to calculate the Probability of Detection (POD), the False Alarm Ratio (FAR), the Critical Success Index (CSI) and the Bias. These parameters tell us the following:
POD – What fraction of tornadoes were correctly tornado-warned? (0 is worst, 1 is best)
FAR – What fraction of tornado-warned events were false alarms? (1 is worst, 0 is best)
CSI – How well did the tornado warnings correspond to confirmed tornadoes? (0 is worst, 1 is best)
Bias – Over-warning (>1) versus under-warning (<1) (1 is optimal)
We use a somewhat relaxed but realistic definition of a tornado warning success or 'hit': the tornado warning has to be issued before, during, or within 10 minutes from the start of the tornado event. This covers a large number of scenarios, including that in which a spotter reports a tornado to ECCC but the weak, brief tornado has dissipated by the time the warning is broadcast (we believe 10 minutes is fair). This extra time allowance should not be a factor for stronger, longer-lived tornadoes that often have a lifetime beyond 10 minutes.
When dealing with multiple tornado events, we consider one tornado warning for a region with three tornadoes in it as three separate hits.
And here are the calculations:
POD = H/(H+M) FAR = FA/(H+FA) CSI = H/(H+M+FA) Bias = (H+FA)/(H+M).
Assessment Results
The following image shows the contingency tables and parameter values using the 2022 data, again considering all tornadoes.
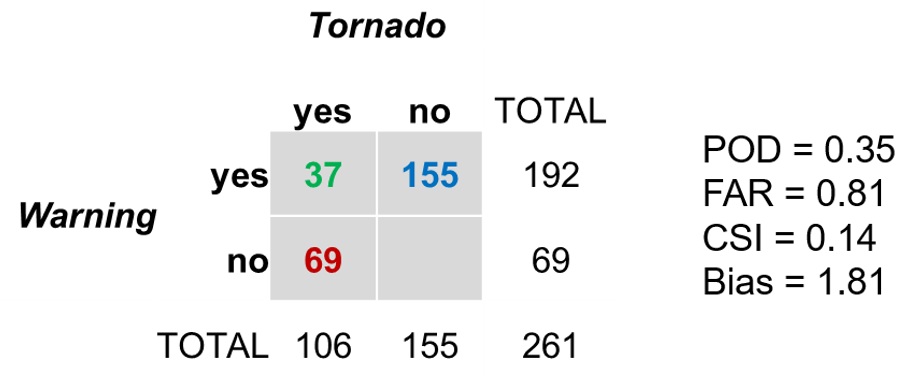
We can look at POD results in a number of ways. For example, is the POD better when the area of interest is confined to the Doppler domain of the radar coverage, since that is where storm rotation signatures can be detected? For tornadoes occurring within Doppler range the POD is 0.38 - so not much higher than for all tornadoes (0.35).
Below are the POD values by EF-scale rating (below). The table shows that the POD increases going from EF0 to EF2+ (from 0.00 to 0.33) but that the highest value is for the default EF0 ranking (i.e., no damage was found). The EF0-Def tornadoes occurred with supercells in Doppler range, and the higher POD for these suggests some may have been strong tornadoes even though they failed to produce any damage.
![]()
We can also compare the POD values for different tornado types. The NTP FAQ defines three types of tornadoes: supercell, quasi-linear convective system (QLCS) and landspout. Supercell storms are capable of producing the strongest tornadoes, up to the top of the EF scale at EF5. Landspout tornadoes form with loosely organized storms and therefore typically produce weak damage, EF0 to EF1 on the EF scale. QLCS tornadoes occur along the leading edge of a line of storms and are typically stronger and longer-lived than landspout tornadoes, though not quite up to the level of supercell tornadoes.
Landspout tornadoes rarely have an identifiable signature on radar, and are often brief, making them the hardest to warn for. Other the other hand, supercell thunderstorms often have prominent, long-lived features that are easy to detect with radar, and they occur in a dynamic environment that can sometimes be forecast days in advance. That makes it (generally) easier to anticipate supercell tornadoes.
It is not always so cut-and-dried when it comes to tornado type, however. In some cases, the tornado is a combination of types - what we call 'hybrid' tornadoes.
The tornado type was subjectively determined for each tornado using (where available) radar imagery, lightning data, satellite imagery, surface weather analysis maps, storm environment information, and visual characteristics of the parent storm. The number of tornadoes, percentage of total tornadoes, and POD for each tornado type are as follows:
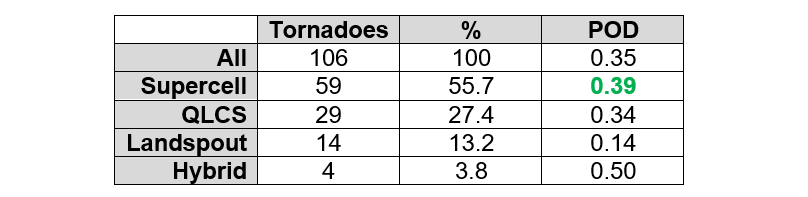
The POD is somewhat higher for supercell tornadoes (0.39), which also make up the largest proportion of tornadoes in the study. The POD for hybrid tornadoes is also relatively high, due to the fact that many of the hybrid cases involve supercell processes, and there is a small sample size (4). For landspouts, the POD is lowest at only 0.14.
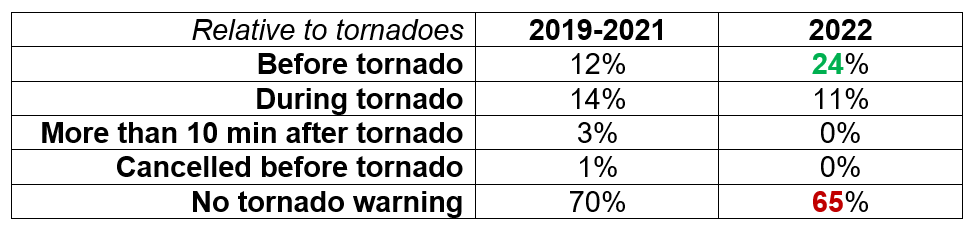
The next table shows when tornado warnings were issued relative to the recorded tornado start times. A reminder here that the first two rows would be considered ‘hits’ in our assessment. The table also compares the 2019-2021 average percentages with the 2022 percentages. The percentage of tornado warnings issued before the tornado start time increased from 12% to 24%. However, a relatively high percentage of tornadoes (65%) still had no tornado warning.
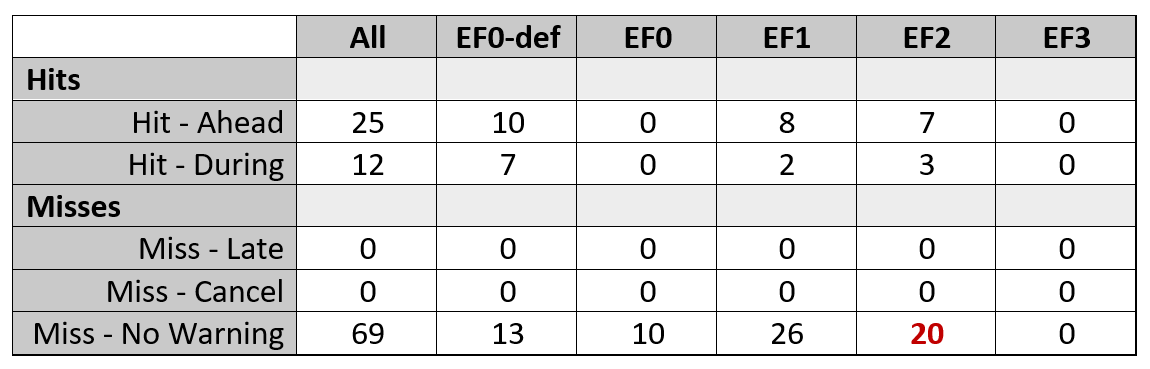
We can also examine the lead time aspect of tornado warnings by EF-scale rating, as seen in the table below. And though the number of EF2+ tornadoes without a tornado warning was higher for 2019-2021 (25), there were still 20 such cases in 2022. In other words, in 2022, there were twice as many EF2 tornadoes without a tornado warning than there were with a tornado warning.
NTP Recommendations
Based on our first independent assessment of ECCC tornado warning performance covering 2019-2021, NTP recommended several actions to increase tornado warning performance in Canada:
* Increase the number of tornado warnings to increase POD and CSI, without significantly increasing FAR,
* Improve lead times by finding ways to get tornado warnings out sooner, mainly by increasing forecaster proficiency and therefore confidence, and
* Ensure forecasters have cutting-edge tornado detection, nowcasting and forecasting tools.
The results from 2022 show that the number of tornado warnings issued across Canada did increase substantially, from an annual average of 87 between 2019 and 2021 to 181 in 2022. This led to an increase in POD from 0.26 to 0.35 (though CSI remained unchanged at 0.14). The percentage of tornado warnings having a lead time of 10 minutes or better also improved, from 9.5% between 2019 and 2021 to 19.8% in 2022. ECCC forecasters should be commended for their efforts here.
So how can tornado warning scores be further improved? More of the same would be good.
Given that 65% of tornadoes – including many EF2 tornadoes – still had no tornado warning, and the POD remains well below the target, there clearly needs to be even more tornado warnings issued. And even if this effort were to be focused on only supercell tornadoes, it will hopefully improve scores for these tornadoes that are the most capable of causing fatalities, injuries and catastrophic damage.
The key to keeping false alarms down while issuing more tornado warnings, and further increasing warning lead times, is enhancing the skill and confidence of forecasters. Expert forecasters are able to quickly attain – and maintain – situational awareness, even when reality begins to deviate from the anticipated scenario. That means they are ready to act when the conditions warrant a warning. They are also able to discriminate between key indicators of tornado potential (e.g. strong Doppler velocity couplet) and look-alikes not associated with tornadoes (e.g. radar sidelobe contamination due to hail).
Finally, while ECCC forecasters have access to a new network of state-of-the-art radars (with Doppler and dual-polarimetric capabilities at S-band), they also need tools that make the most of the data from these radars: for reliable storm tracking, sophisticated severe weather feature detection, and storm intensity nowcasting. Beyond the forecast office, one unsolved problem with the signal processing for the new radars – ‘second-trip’ contamination – continues to make the detection of key tornado-related radar features difficult at times. Tackling these issues requires a sustained research and development effort, perhaps in coordination with industry and/or academia.
Summary
NTP has completed its second annual independent assessment of tornado warning performance in Canada, covering the 2022 season. The main results are:
* Though the Probability of Detection of 0.35 for ECCC tornado warnings is still well below their target of 0.5, it is a significant improvement over the 2019-2021 average of 0.26,
* Improvements in tornado warning POD and lead time, and an increased number of tornado watches preceding successful tornado warnings, led to passing grade (56.6%) on NTP’s tornado warning performance assessment ‘report card’ for 2022, and
* While a tornado warning was issued before tornado development 24% of the time in 2022 (up from 12% for 2019-2021), 65% still had no tornado warning.
Acknowledgements
Thanks to MSC staff for comments on the 2019-2021 assessment that improved the 2022 assessment, to Instant Weather for help with tracking down all of the alert messages in 2022, and to Misheyla Iwasiuk for allowing us to use her amazing Scarth tornado photo once again.