A revised 1980-2009 Canadian tornado database
The NTP has revised the 1980-2009 Canadian tornado database, substantially increasing the number of events and the quality of documentation.
The creation of the original 1980-2009 Canadian tornado database (found here) at ECCC was led by Dr. David Sills and involved the help of many - with key contributors being Brad Rousseau, Patrick McCarthy and Lesley Elliott, plus a long succession of interns and summer students. It was a significant accomplishment and has been widely used. A conference paper describes how the data were assembled (here).
However, there are tools for event investigation available now that were not available then. In particular, historical satellite imagery (e.g. Landsat) allows an overhead view of past events that in some cases substantially improves the event assessment. In other cases, new tornadoes were discovered (even some quite large ones) that had not been previously detected. Many of these were found by Kunkel et al. (2023) in the forested areas across Canada. We have also learned a lot about tornadoes in Canada since the time that the initial work was done, particularly through the work of the NTP.
Comparing the new data set statistics to those from the original data set (see here), the new 1980-2009 data set has 1949 tornadoes while the original had 1839 - an increase of 110 tornadoes. Most of those tornadoes were F0 to F2, though there is now one more F3 as well. The number of documented casualties has increased from 947 to 992, and the estimated losses have increased from over $547M to over $762M.
The number of tornadoes with path data, and the accuracy of path lengths in general, has increased. The total path length over the 30-year period has gone from nearly 3100 km to over 4600 km. The average path width (using the widest point along the path) also increased substantially, from 249 m to 348 m for all tornadoes and from 391 m to 582 m for F2+ tornadoes.
Though the average number of tornadoes per year for the 1980-2009 period had a small increase, from 61.3 per year to 65.0 per year, the number of F2+ tornadoes per year increased substantially from 5.2 to 6.9.
Some of the 'extremes' have changed as well. The single day with the most recorded tornadoes remains 20 Aug 2009 in southern Ontario, but the number of tornadoes that day has increased from 19 to 22 - based on the re-analysis. The widest recorded tornado over that period is now the 2007 Odin Lake, ON F2 tornado at 2020 m. And the latest-in-the-season recorded tornado is now the 16 Nov 1989 Mont St-Hilaire, QC F2 tornado.
The following are the main significant event revisions made by the NTP for the 1980-1999 period:
- re the 15 Jul 1984 tornado outbreak in QC, the Lac Blue Sea tornado is now a new individual tornado and is rated F2 while the Nichabau tornado is still rated F3
- the 1986 Brady Lake - Maynooth F2 tornado track was re-assessed using historical satellite imagery and turned out to be much wider, much longer, and started at Little Paul Lake (thus Brady Lake has been replaced by Little Paul Lake in the event name)
- a 1991 Maryfield, SK F2 was removed because it turned out to be covered in another event
- the track of the 1994 Laurel, QC F2 tornado was improved
- the 1994 Carp, ON and Aylmer, QC F2s were combined into one cross-border tornado based on historical satellite imagery, and the Alexandria, ON tornado from the same day was upgraded from F1 to F2 based on new damage information
- the 1999 Drummondville, QC tornado was upgraded to F2 based on new damage information
- two weak tornadoes were removed because the documentation made it clear the reports were based on second-hand information (which we avoid using with NTP): 1985 Mazenod, SK and 1987 Netherhill, SK
Changes made to events are described in the 'Comments' column for those events (yes, the event comments are now also included for the first time).
As laid out in the previous blog post, you will be able to view and plot tornadoes from this new data set using the Advanced Dashboard being released on Friday. Some sample images from the 1980-2009 data set plotted using the Advanced Dashboard are provided below.
The new 1991-2020 data set will be discussed in a blog post on Thursday. So keep an eye out for that...
Acknowledgements
There have once again been a number of contributors to the revised 1980-2009 data set, but the key personnel involved were Joanne Kunkel, Lesley Elliott, Francis Lavigne-Theriault, Liz Sutherland, Jordan Fuller, Maia Somers and David Sills. And thanks to ImpactWX for the support of this project.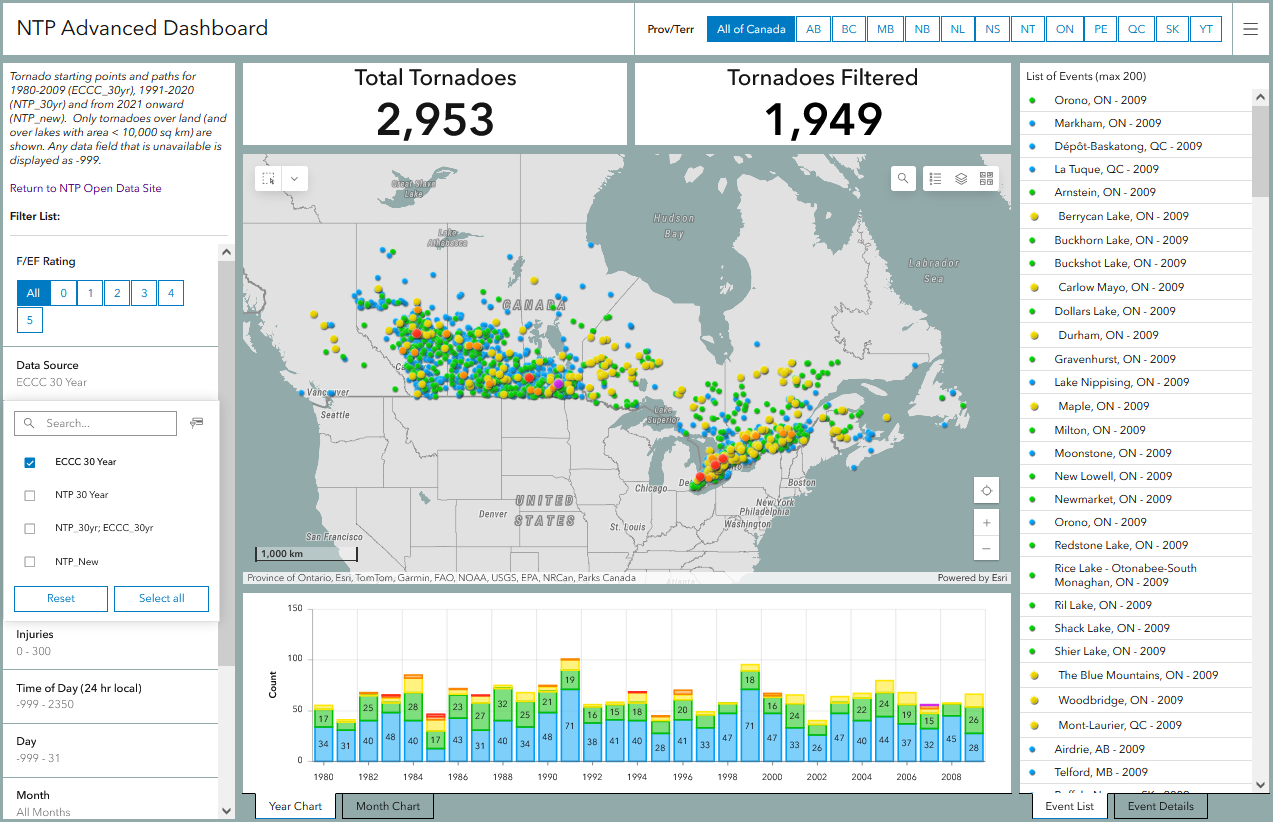
All 1949 tornadoes from the 1980-2009 data set (called ECCC_30yr) with annual count chart below.
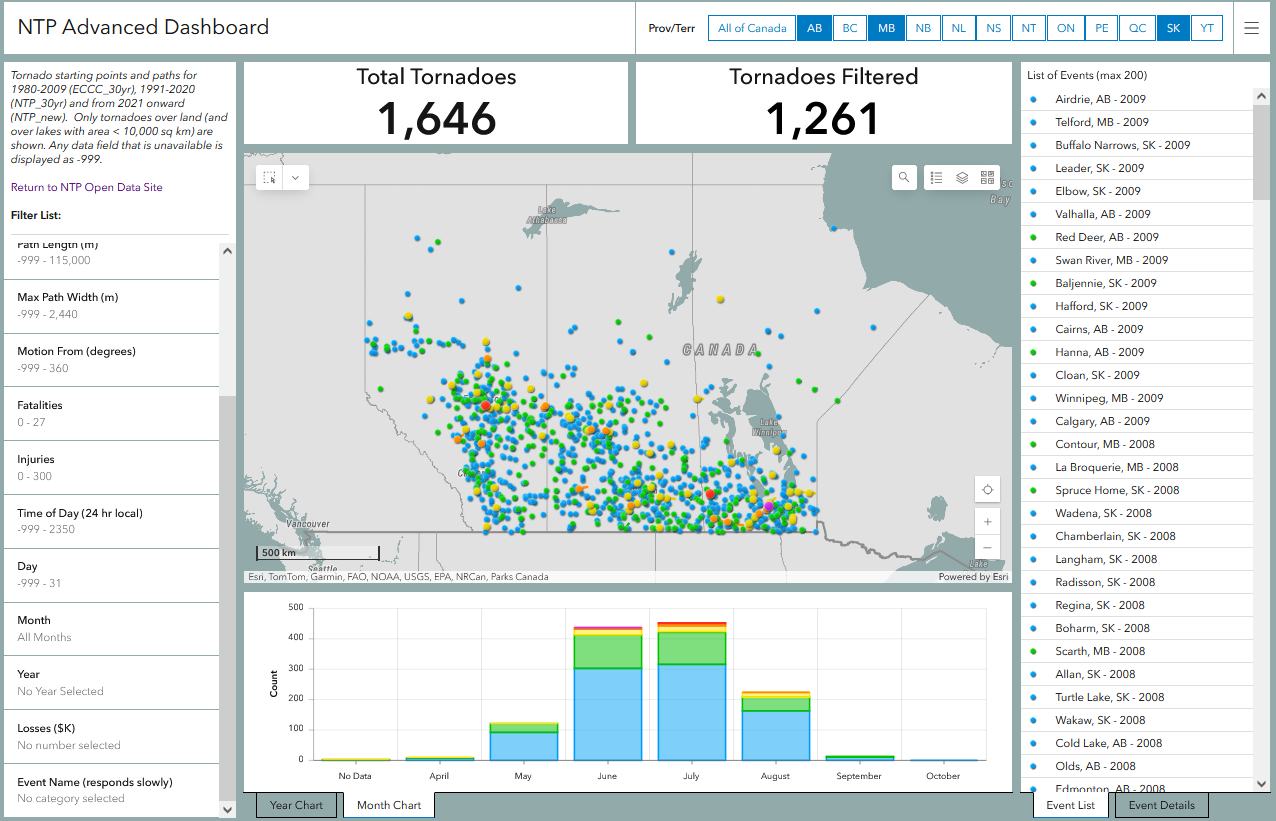
All 1261 Prairie tornadoes from the 1980-2009 data set with monthly total chart below.
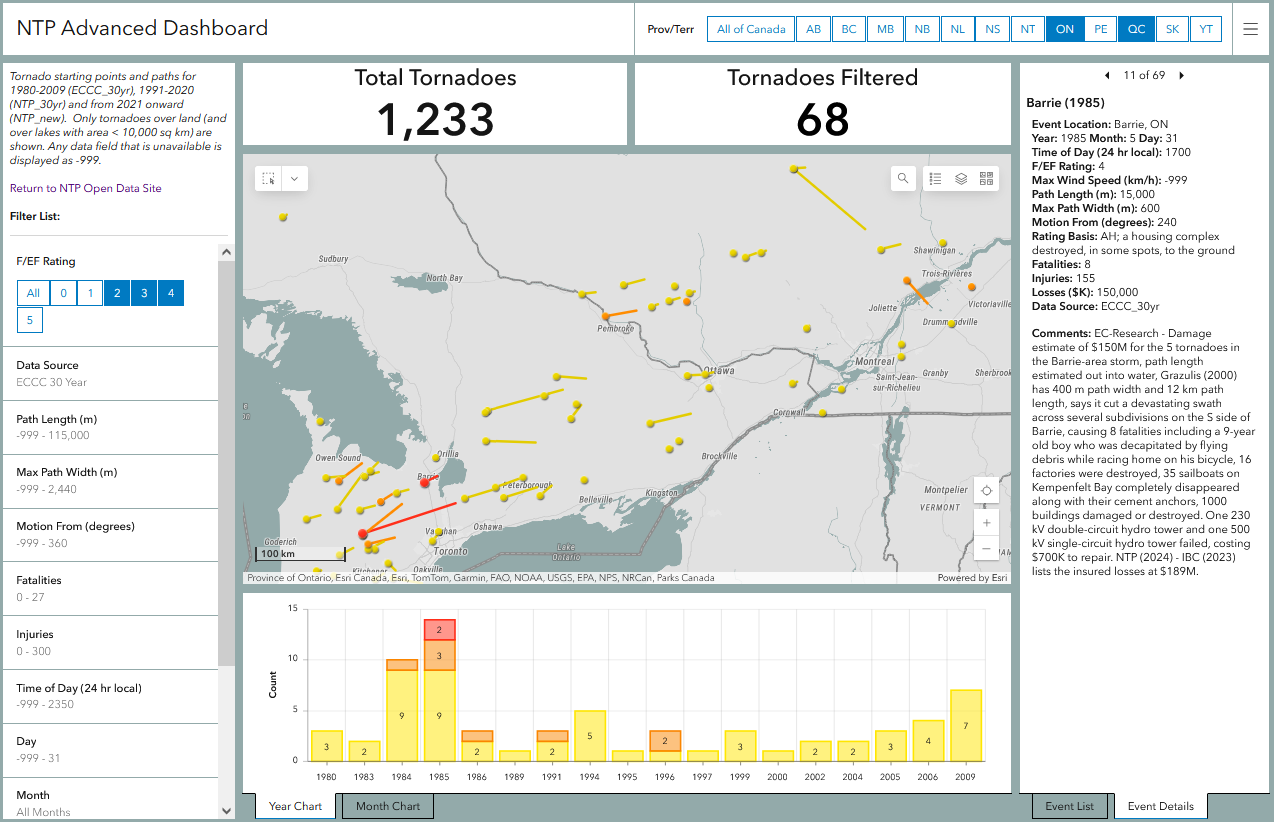
All 68 Ontario and Quebec F2+ tornadoes from the 1980-2009 data set with annual count chart below.
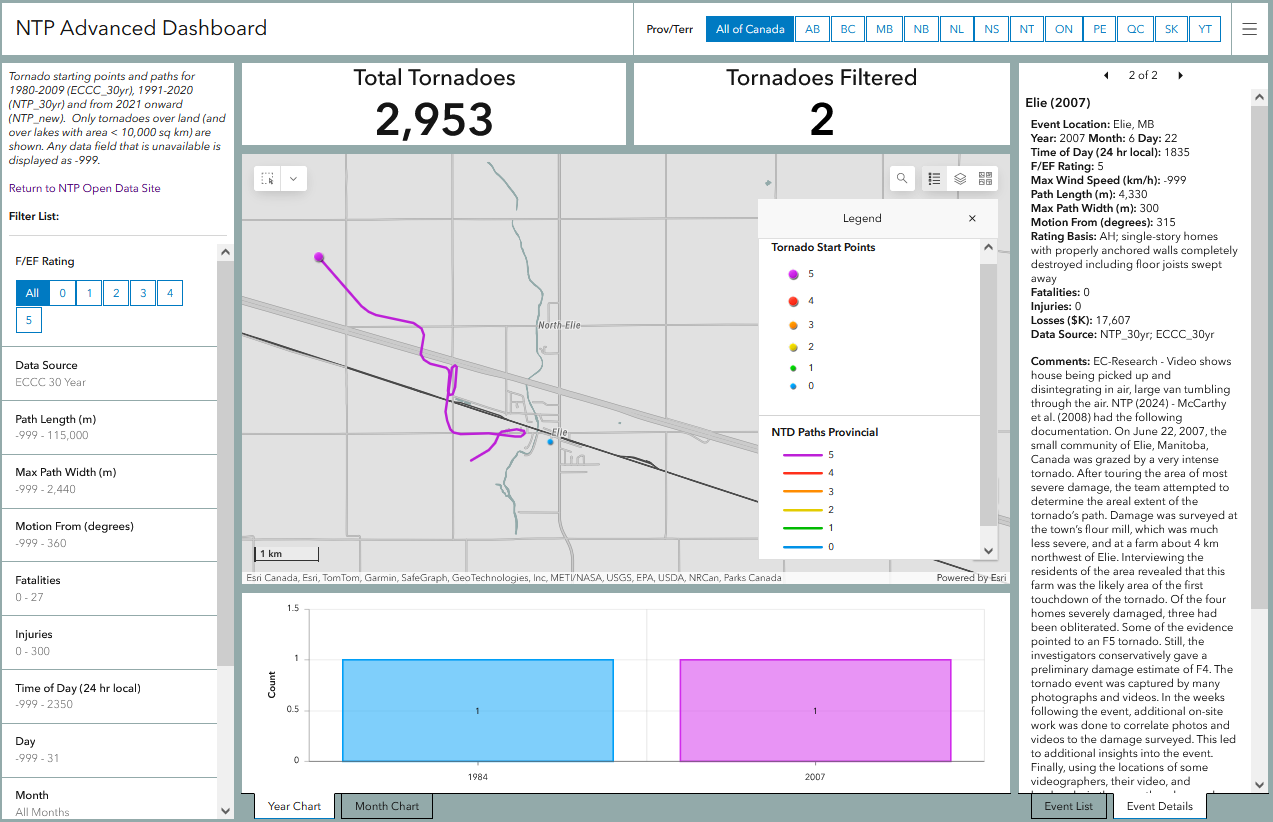
Zoomed image of the 2007 Elie, MB F5 tornado showing the enhanced track detail (including two loops). A number of tornadoes have this enhanced track detail and more will be added later.