New NTP tool for AI-assisted satellite review
The Northern Tornadoes Project has the goal of detecting every tornado that occurs in Canada. However, due to Canada’s vast area – much of it treed – tornado damage often occurs in remote forested regions away from population centres. Therefore the damage may go unreported.
In order to find these unreported tornadoes, researchers at the NTP perform an end-of-season systematic sweep of Canada’s treed areas using high-resolution satellite imagery. By comparing satellite imagery between different dates, swaths of damaged trees can be detected and classified as tornado damage, among other types (mainly downburst damage).
Performing manual systematic sweeps of satellite imagery for these forested regions (over 3.2 million km2 in 2024) is tedious and time consuming – roughly 300 person-hours. Currently, a team of NTP researchers takes multiple months to complete the work, since fatigue sets in after 3-4 hours of visual scanning.
Daniel Butt started out as an intern with the NTP but is now a PhD candidate in Software Engineering at Western and a part-time researcher with the NTP, based mainly on his success with automatically identifying treefall using drone and aircraft imagery (Butt et al. 2024) and also using the directions of treefall along with a tornado damage model to estimate peak tornado wind speeds (Butt et al 2025).
In order to speed up the satellite review process described above and make better use of staff time, Daniel was asked if he could apply his expertise to the problem of identifying tornadoes in satellite images – which have a high nominal resolution (3-5 m) but one that is much lower than that for drone and aircraft imagery (1-5 cm). And Daniel once again delivered – the NTP is now currently testing his model, and the results so far have been quite promising. Numerous potential 2025 tornadoes (and downbursts) have been identified across the country and these results are being manually verified, with the first batch of results to be published shortly.
Below, Daniel describes the new model that allows ‘AI-assisted satellite review’.
====
Due to the rarity and diversity of tornado and downburst tracks, existing computer vision object detection architectures, such as Mask R-CNN models, may fail to achieve a high enough accuracy to detect every tornado and downburst in the vast search area. Instead of directly predicting tornadoes and downbursts, a forest damage detection model was developed.
This model utilizes a convolutional neural network to automatically compare small sections of satellite imagery between different dates and identify regions that contain changes to the forest consistent with tornado and downburst damage. Resultingly, only areas that the model predicts as having a high confidence of forest damage need to be manually searched for damage tracks, substantially speeding up the required search time.
To accomplish this task, a systematic search software add-in for ArcGIS Pro is being developed, which utilizes the following methodology.
First, two sets of high-quality satellite imagery are obtained, showing a one-year difference in Canada's forests around the same time of year (usually late summer). For this project, Planet Labs’ monthly (4.7 m) base map imagery is utilized, comparing consistent and standardized imagery in August between consecutive years.
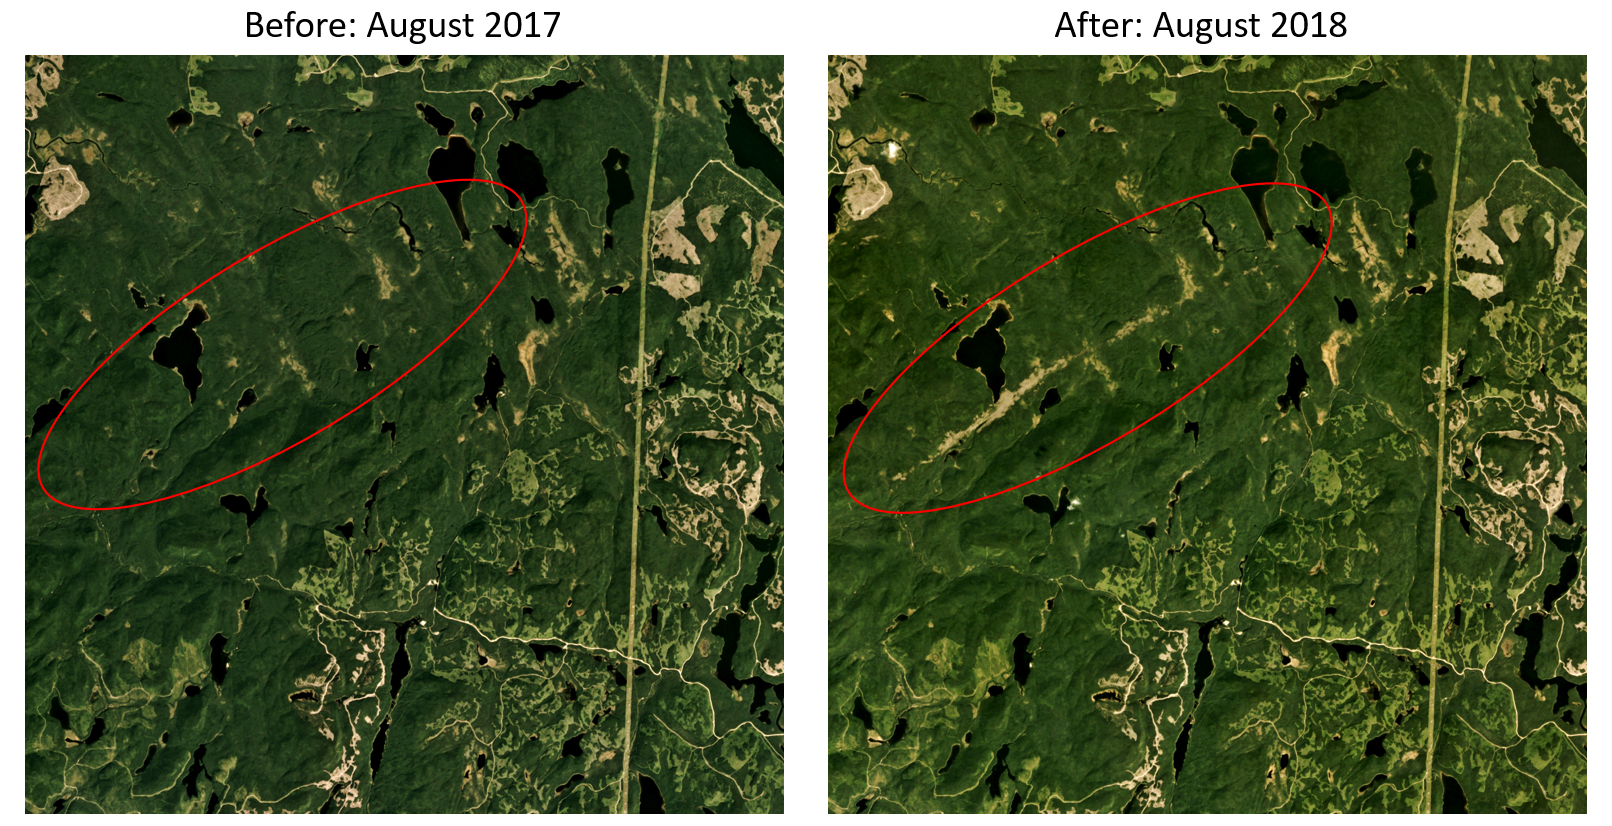
Before and after satellite images from Planet.com, with tornado damage path circled in red.
Next, the before and after images are then filtered to remove areas that are unlikely to contain trees or have low visibility. The Government of Canada provides land cover maps which can be used to filter out bodies of water, urban areas, and most roads. Planet Labs provides a usable data mask (UDM) which identifies areas that are obstructed by cloud cover or of low visibility. Finally, areas of tree damage are apparent in the imagery due to colour changes, often from a greenish colour to a brownish colour. This distinctive colour change can be filtered for by only considering pixels with an increase in the red band going from the before to the after image.
Third, small sections (32x32 pixels, ~150x150 m) of the filtered before and after images are fed in parallel into a convolutional neural network which predicts a confidence score as to whether the section contains tree damage consistent with that caused by tornadoes. This highlights areas with a high probability of suspected tree damage.
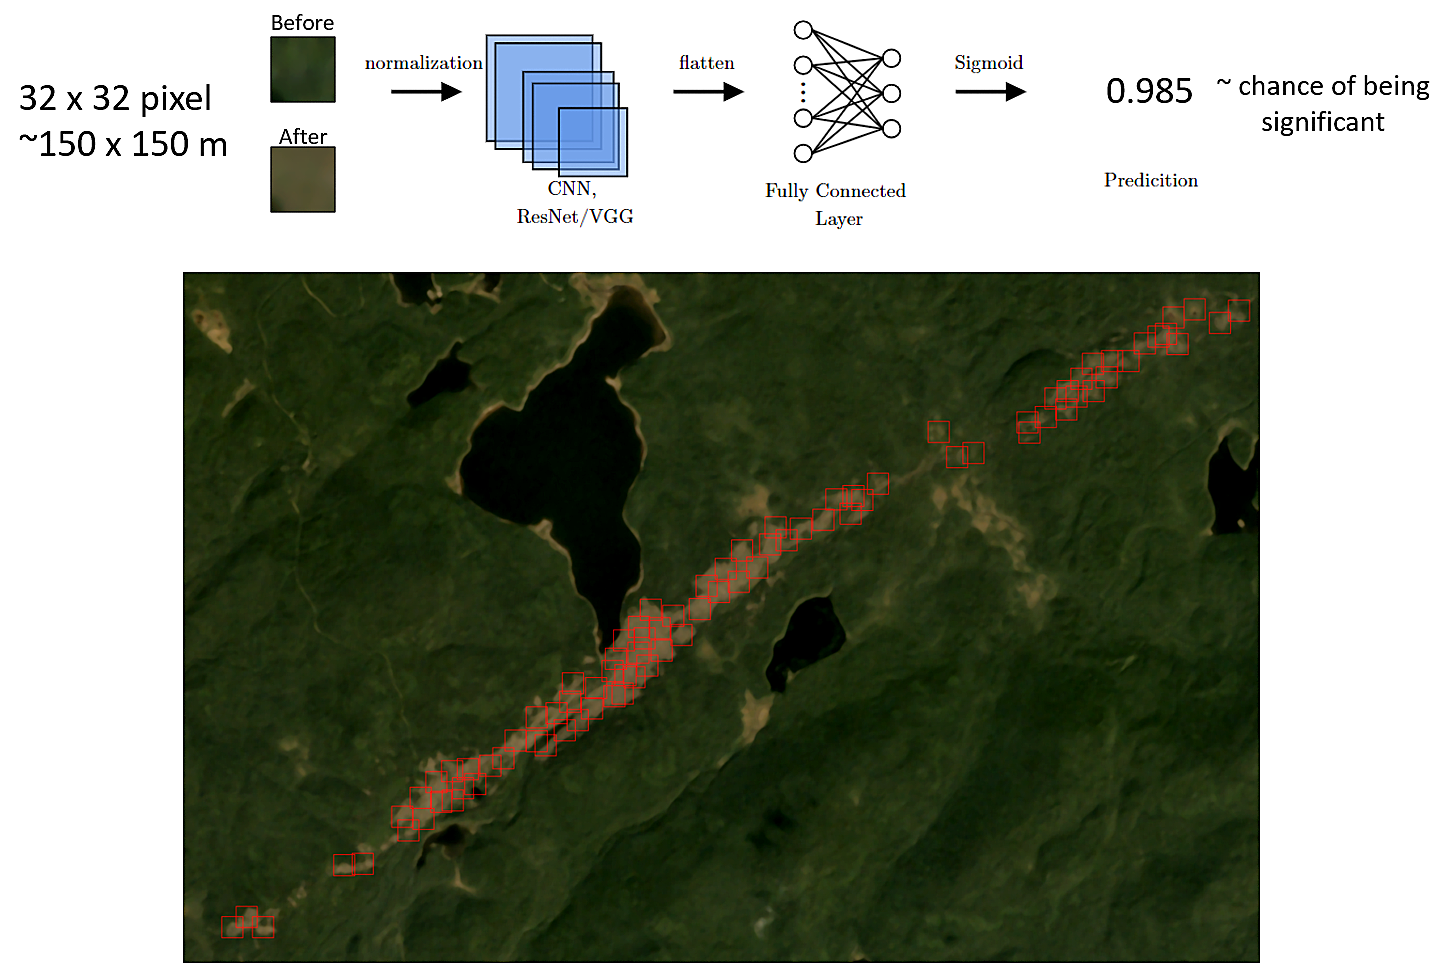
Convolutional neural network tree damage patch prediction model diagram
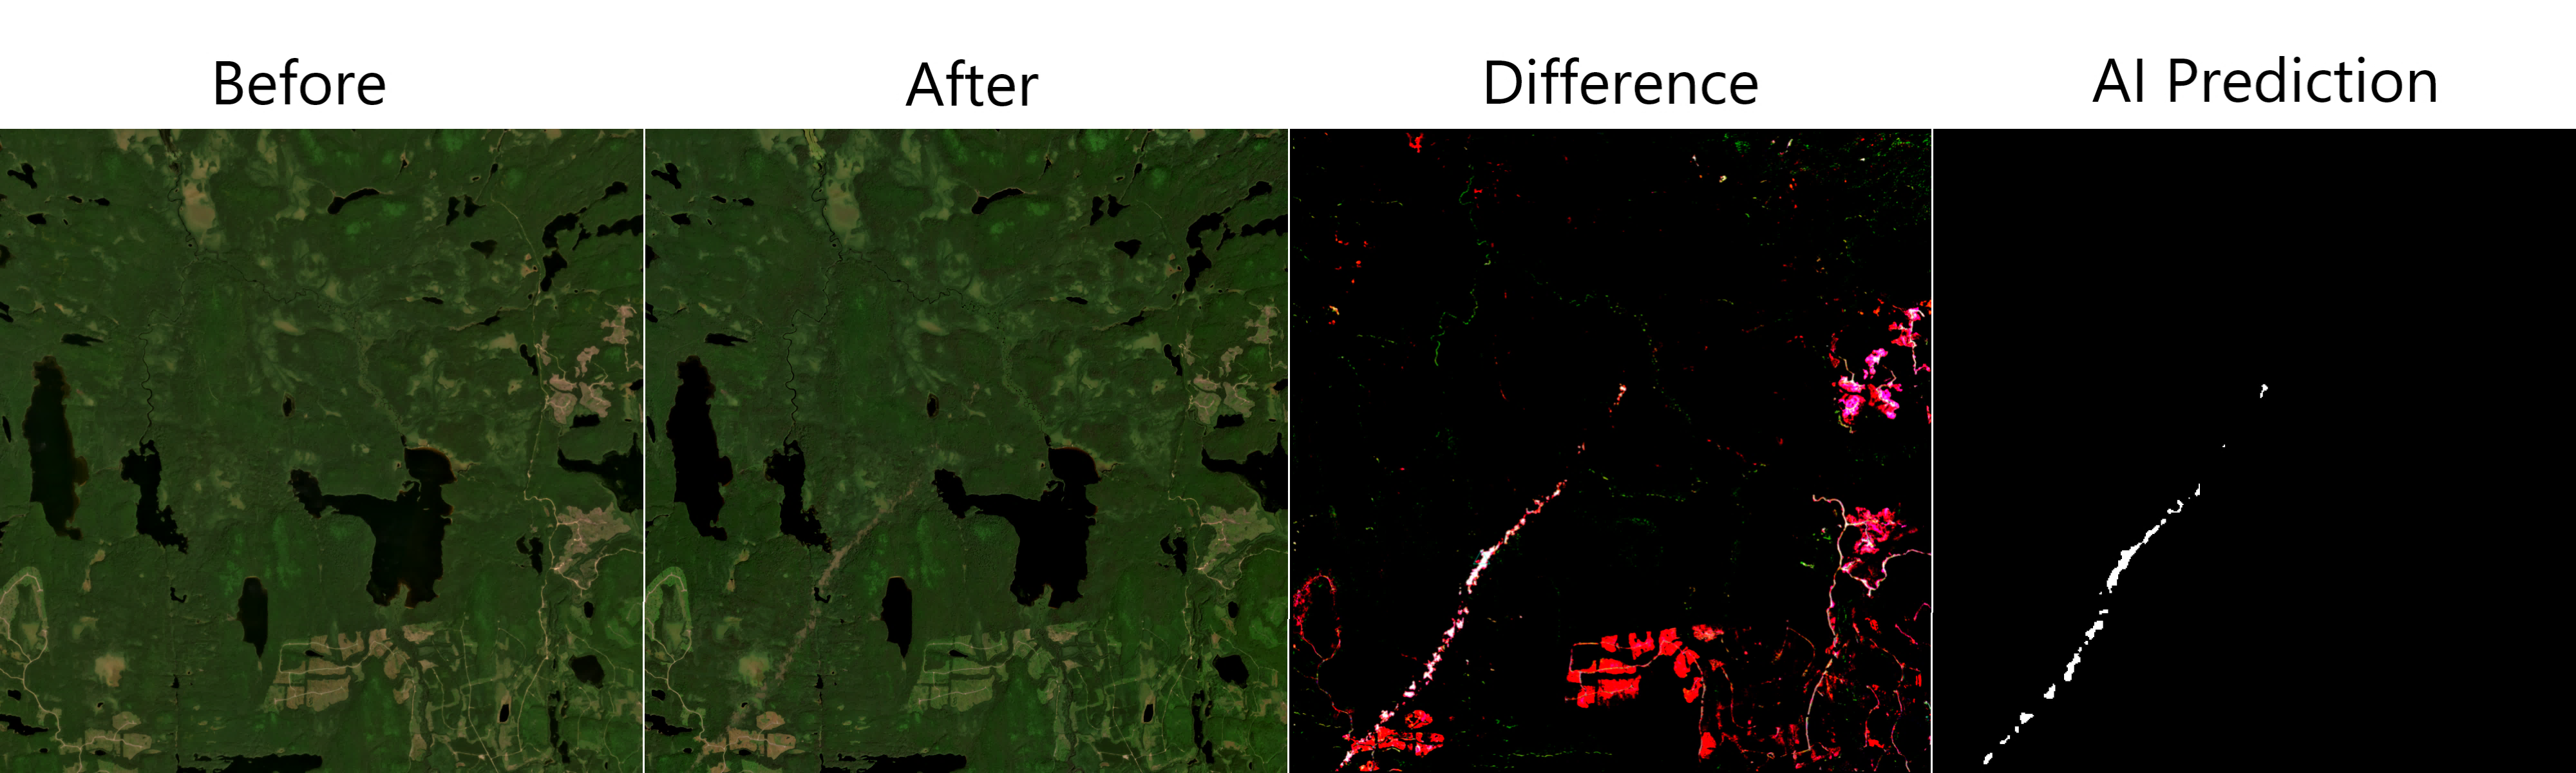
Example before and after satellite imagery (Planet Labs 4.7 m) of the Lac Pedro tornado. The difference image is a contrast enhance absolute difference between the before and after image. The AI prediction is binary mask of the model’s predictions that have a high confidence of suspected tree damage consistent with tornadoes.
Finally, only areas identified to have a high confidence of tree damage need to be manually reviewed, substantially reducing the manual labour required from a brute force search.
Currently this system is still under development and serves as a proof of concept. Over the next few years, we plan to continue making improvements to the algorithm and increasing our dataset size and quality. Nevertheless, results for this year seem promising. If you see “AI-assisted satellite review” in an event summary, you’ll know this new approach was used.
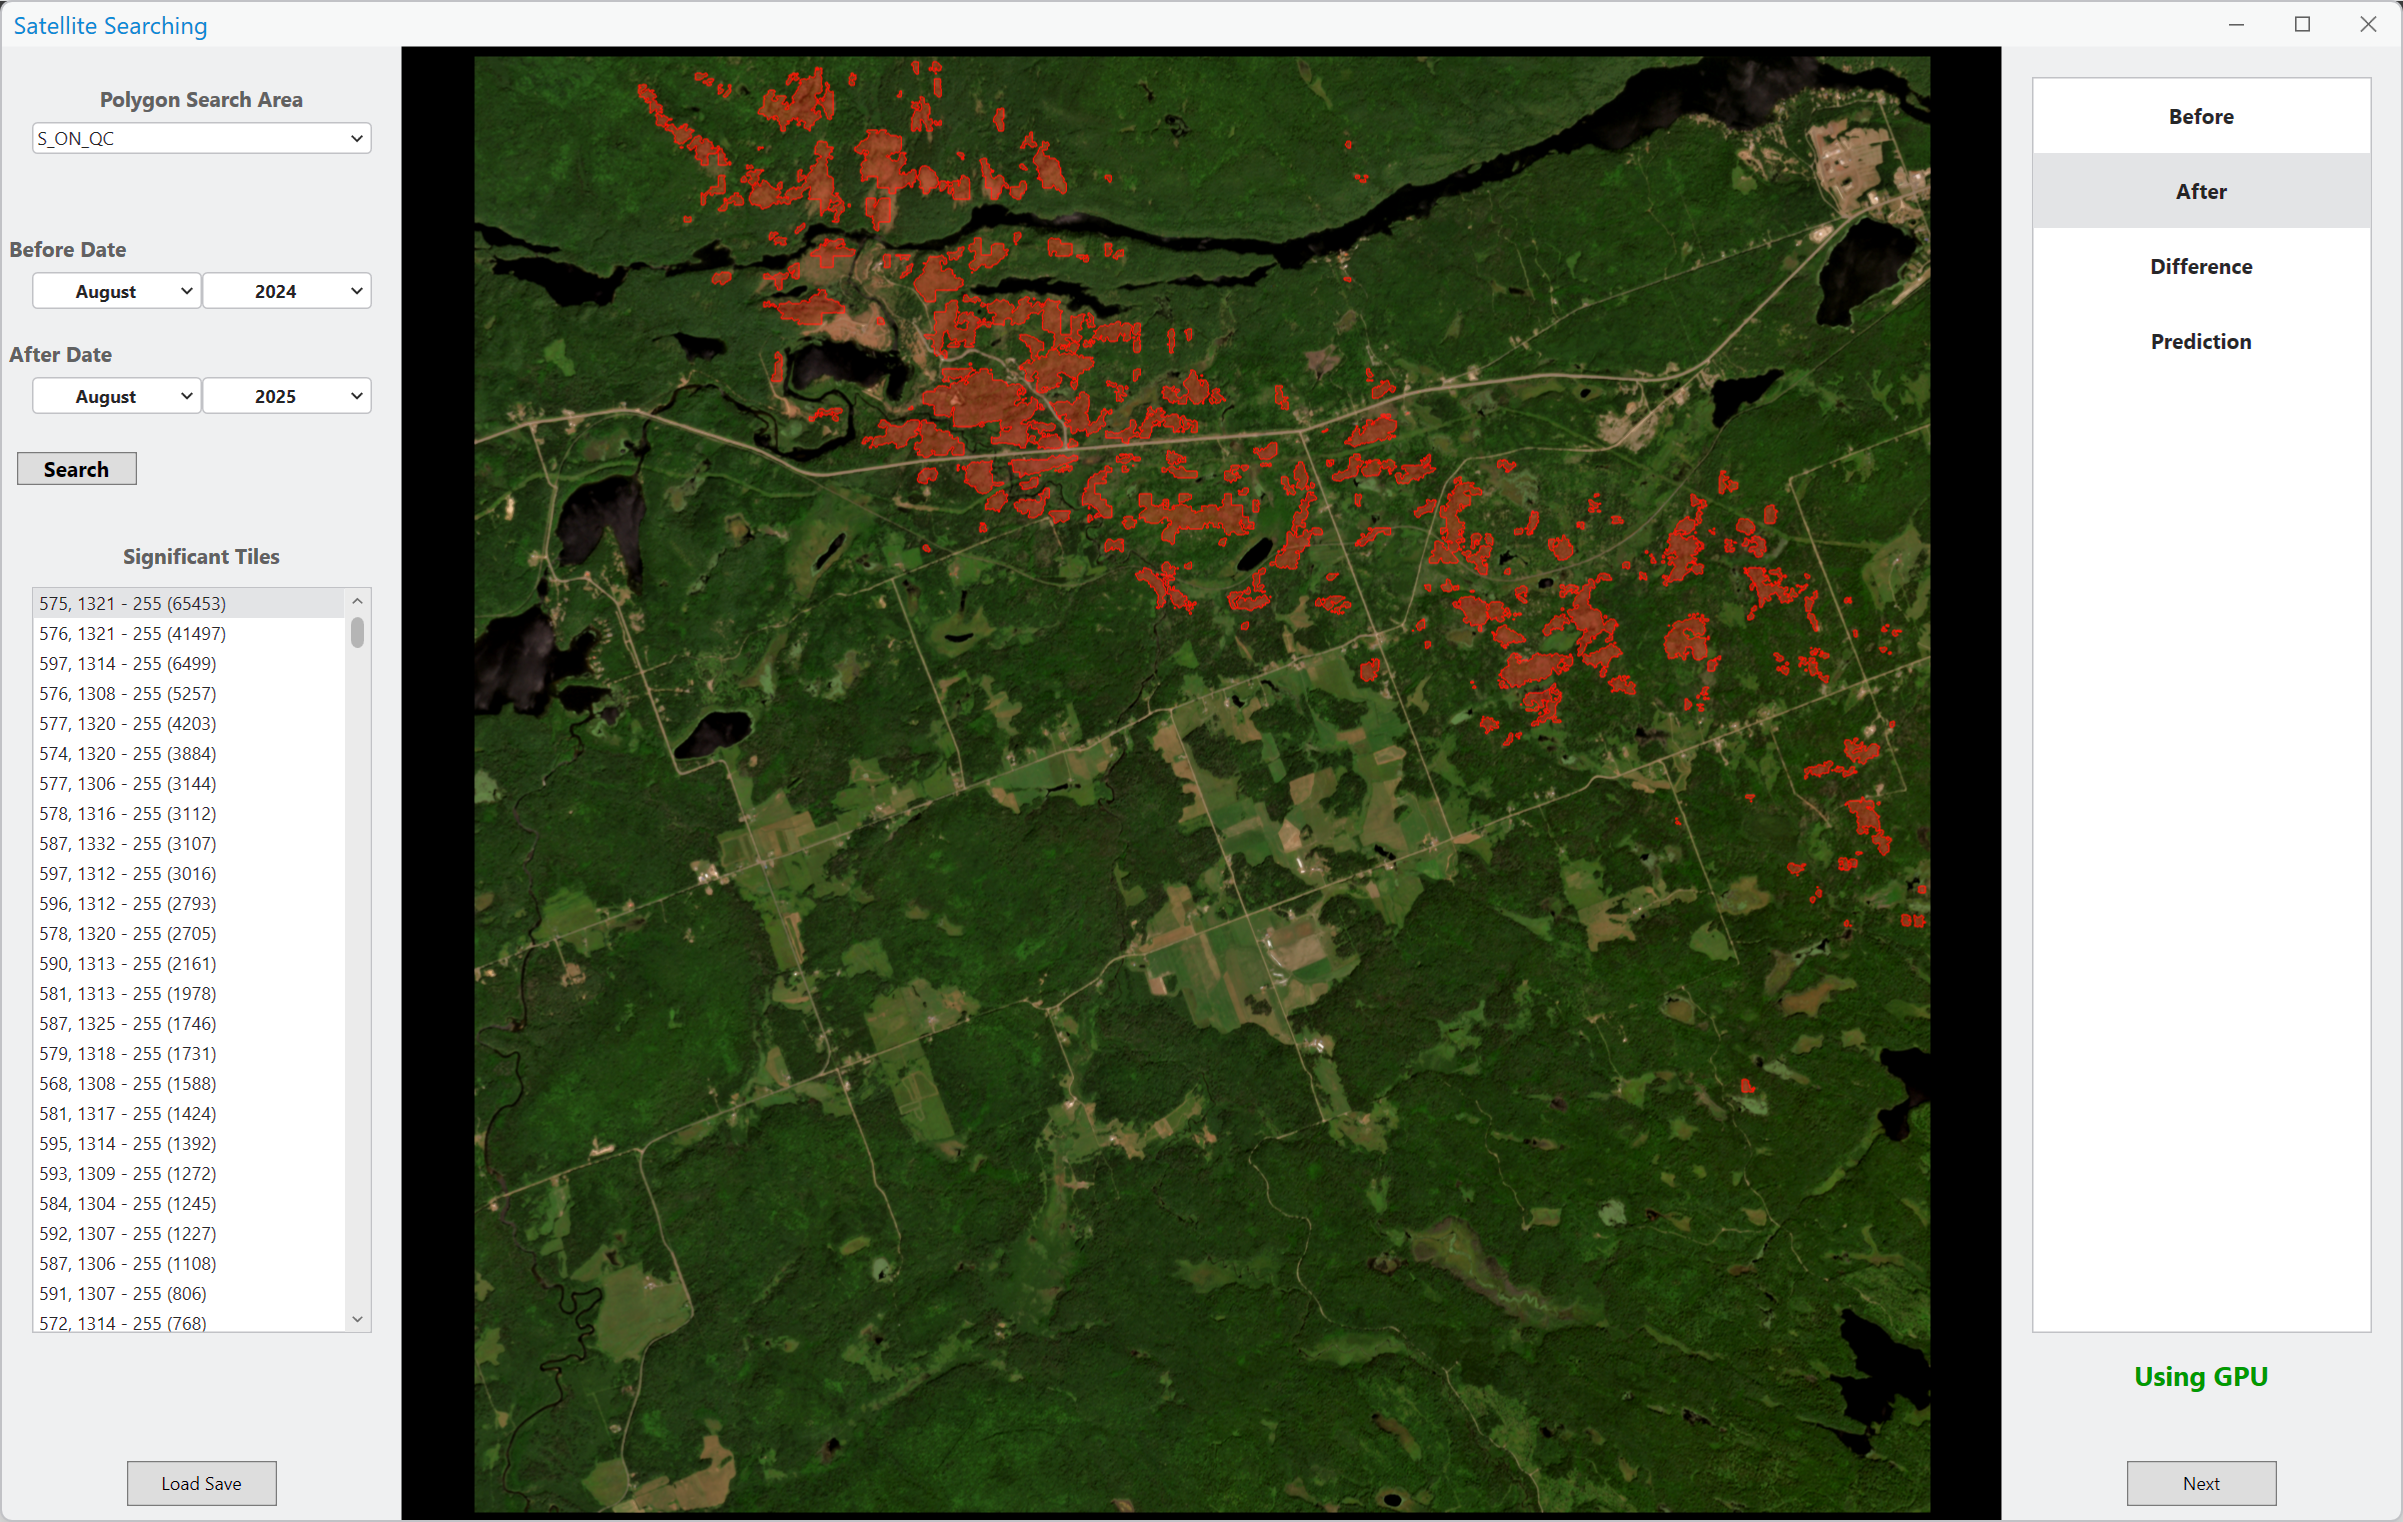
Systematic satellite search software graphical user interface. The highlighted red areas indicate a high confidence of significant tree damage detected by the model.
References
Butt, D. G., T. A. Newson, C. S. Miller, D. M. L. Sills and G. A. Kopp, 2025: Analysis of forest-based tornadoes using treefall patterns. Mon. Wea. Rev., DOI https://doi.org/10.1175/MWR-D-24-0249.1.
Butt, D. G., A. L. Jaffe, C. S. Miller, G. A. Kopp and D. M. L. Sills, 2024: Automated large-scale tornado treefall detection and directional analysis using machine learning. Artificial Intelligence for the Earth Systems, DOI 10.1175/AIES-D-23-0062.1.